
Figure 4.
- ID
- ZDB-IMAGE-220328-27
- Antibodies
- Publication
- Kilroy et al., 2022 - Beneficial impacts of neuromuscular electrical stimulation on muscle structure and function in the zebrafish model of Duchenne muscular dystrophy
- All Figures
- Figures for Kilroy et al., 2022
|
Figure 4.
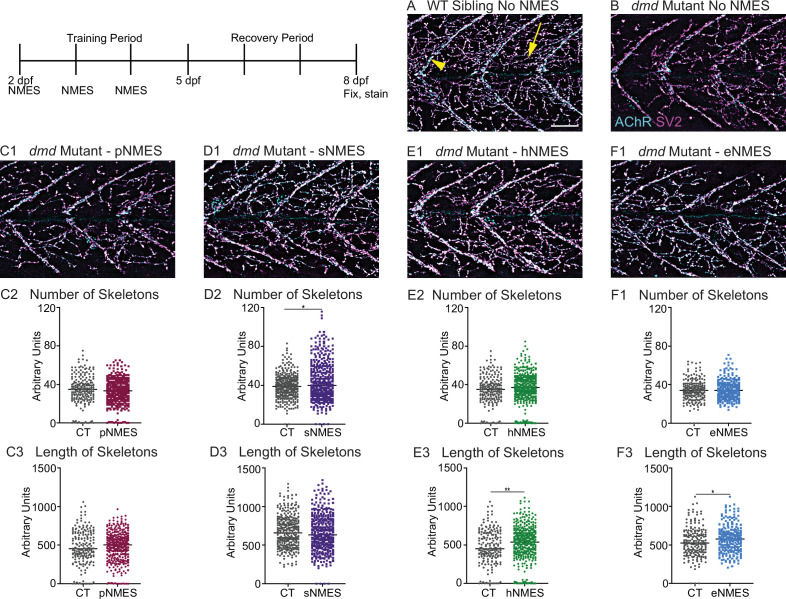
Anti-SV2 (cyan) alpha-bungarotoxin (AChR; magenta) visualize the pre- and postsynaptic components of the NMJ, respectively. (A) Representative image of WT sibling. Myoseptal innervation, innervation at the chevron-shaped myotendinous junction (yellow arrowhead) is slow-twitch innervation. Fast-twitch muscle innervation is the network between the MTJs, yellow arrow points to fast-twitch muscle innervation. (B) Representative image of dmd mutant demonstrates a visible reduction in innervation, with relatively large portions of the muscle segments lacking innervation. (C1, D1, E1, F6) Representative images of dmd mutants that completed three sessions of the NMES paradigms. NMJ images were skeletonized as previously described. Strength NMES(sNMES) was the only paradigm that increased the number of skeletons (D2). Both hypertrophy NMES (hNMES) and endurance NMES (eNMES) increase skeleton length (E3, F3). Power NMES did not change the number or length of skeletons compared to dmd mutant controls (C2,3). Scale bar is 50 µm. NMJ data were analyzed using either an ordinary one-way ANOVA with Tukey’s multiple comparisons test or a Kruskal–Wallis test with Dunn’s multiple-comparison test. **p<0.01, ***p<0.001, ****p<0.0001.
Impacts of neuromuscular electrical stimulation (NMES) paradigms on neuromuscular junction (NMJ) structure.