IMAGE

Figure S3.

ID
ZDB-IMAGE-220328-18
Source
Figures for Krishnan et al., 2022
Image
Figure Caption

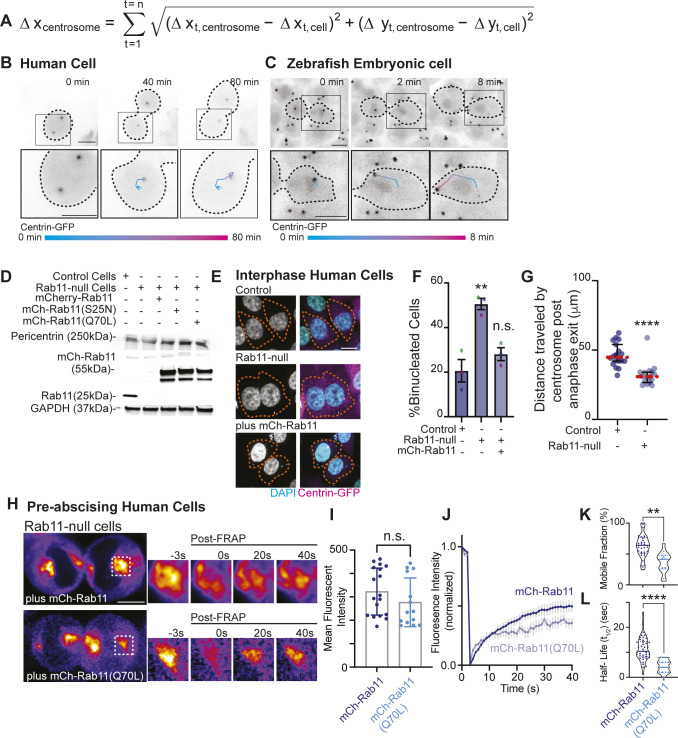
Figure S3. Rab11 GTPase function is associated with centrosome bridge-directed movement.

(A) Equation to calculate distance traveled by centrosome in relation to the cell. This involves recording movement of the centrosome and the cell body as vectors and using vector subtraction to calculate centrosome movement within the reference frame of the cell to accurately calculate distance traveled by the centrosome. (B, C) Time lapse of a pre-abscising human (HeLa) cell (B) and zebrafish embryo cell (C). (A) Inset with associated track (color gradient represents time) of distance traveled by centrosome (cell body centered for each time point) using equation in (A). Scale bar, 10 μm. Black dashed lines, cell boundaries. Color gradient line, time. (D) Western blot immunolabeled for Rab11 and Pericentrin with GAPDH loading control in control cells, Rab11-null cells and Rab11-null cells ectopically expressing mCh-Rab11, -Rab11(S25N), and -Rab11(Q70L). (E, F) Representative images of fixed interphase human (HeLa) cells with a single nucleus or bi-nuclei labeled using DAPI (gray, left; cyan, merge) and Centrin-GFP (magenta) shown (E). Orange dashed lines, cell boundaries. Scale bar, 10 μm. (F) Percentage of binucleate cells calculated for n > 100 cells counted per experiment across n = 3 experiments (F). One-way ANOVA with Dunnett’s multiple comparison with control cells shown, n.s. not significant and **P < 0.01. (G) Total distance traveled by centrosome during pre-abscission measured and depicted as a scatter plot with the median (orange dashed line) and quartiles (dark lines) shown. n > 8 cells per condition across n > 3 experiments. Two-tailed t test, ****P < 0.0001. (H, I, J, K, L) Rab11-null cells ectopically expressing mCh-Rab11 and -Rab11(Q70L) shown (fire, LUT). Region of interest photobleached highlighted in inset (right), pre- and post-FRAP. Scale bar 10 μm (H). mCh-Rab11 (blue dots, lines) and -Rab11(Q70L) (cyan dots, lines) mean fluorescent intensity calculated and presented as a bar graph with mean ± SEM, n > 15 cells per condition. (I) Two-tailed t test, n.s. not significant (I). (J) FRAP trace of mCh-Rab11 and -Rab11(Q70L) shown for n > 15 cells per condition (J). (K, L) mCh-Rab11 and -Rab11(Q70L) mobile fraction (K) and half-life (t1/2, L) calculated and presented as violin plot with median (dark blue line, mCh-Rab11; cyan line, mCh-Rab11(Q70L)) and quartiles (dark blue dotted lines, mCh-Rab11; cyan dotted lines, mCh-Rab11(Q70L)) for n > 15 cells per condition. Two-tailed t test, **P < 0.01 and ****P < 0.0001. n-values and statistical results detailed in Table S1.

Acknowledgments
This image is the copyrighted work of the attributed author or publisher, and ZFIN has permission only to display this image to its users. Additional permissions should be obtained from the applicable author or publisher of the image. Full text @ Life Sci Alliance