IMAGE

Figure 3.

ID
ZDB-IMAGE-220328-17
Source
Figures for Krishnan et al., 2022
Image
Figure Caption

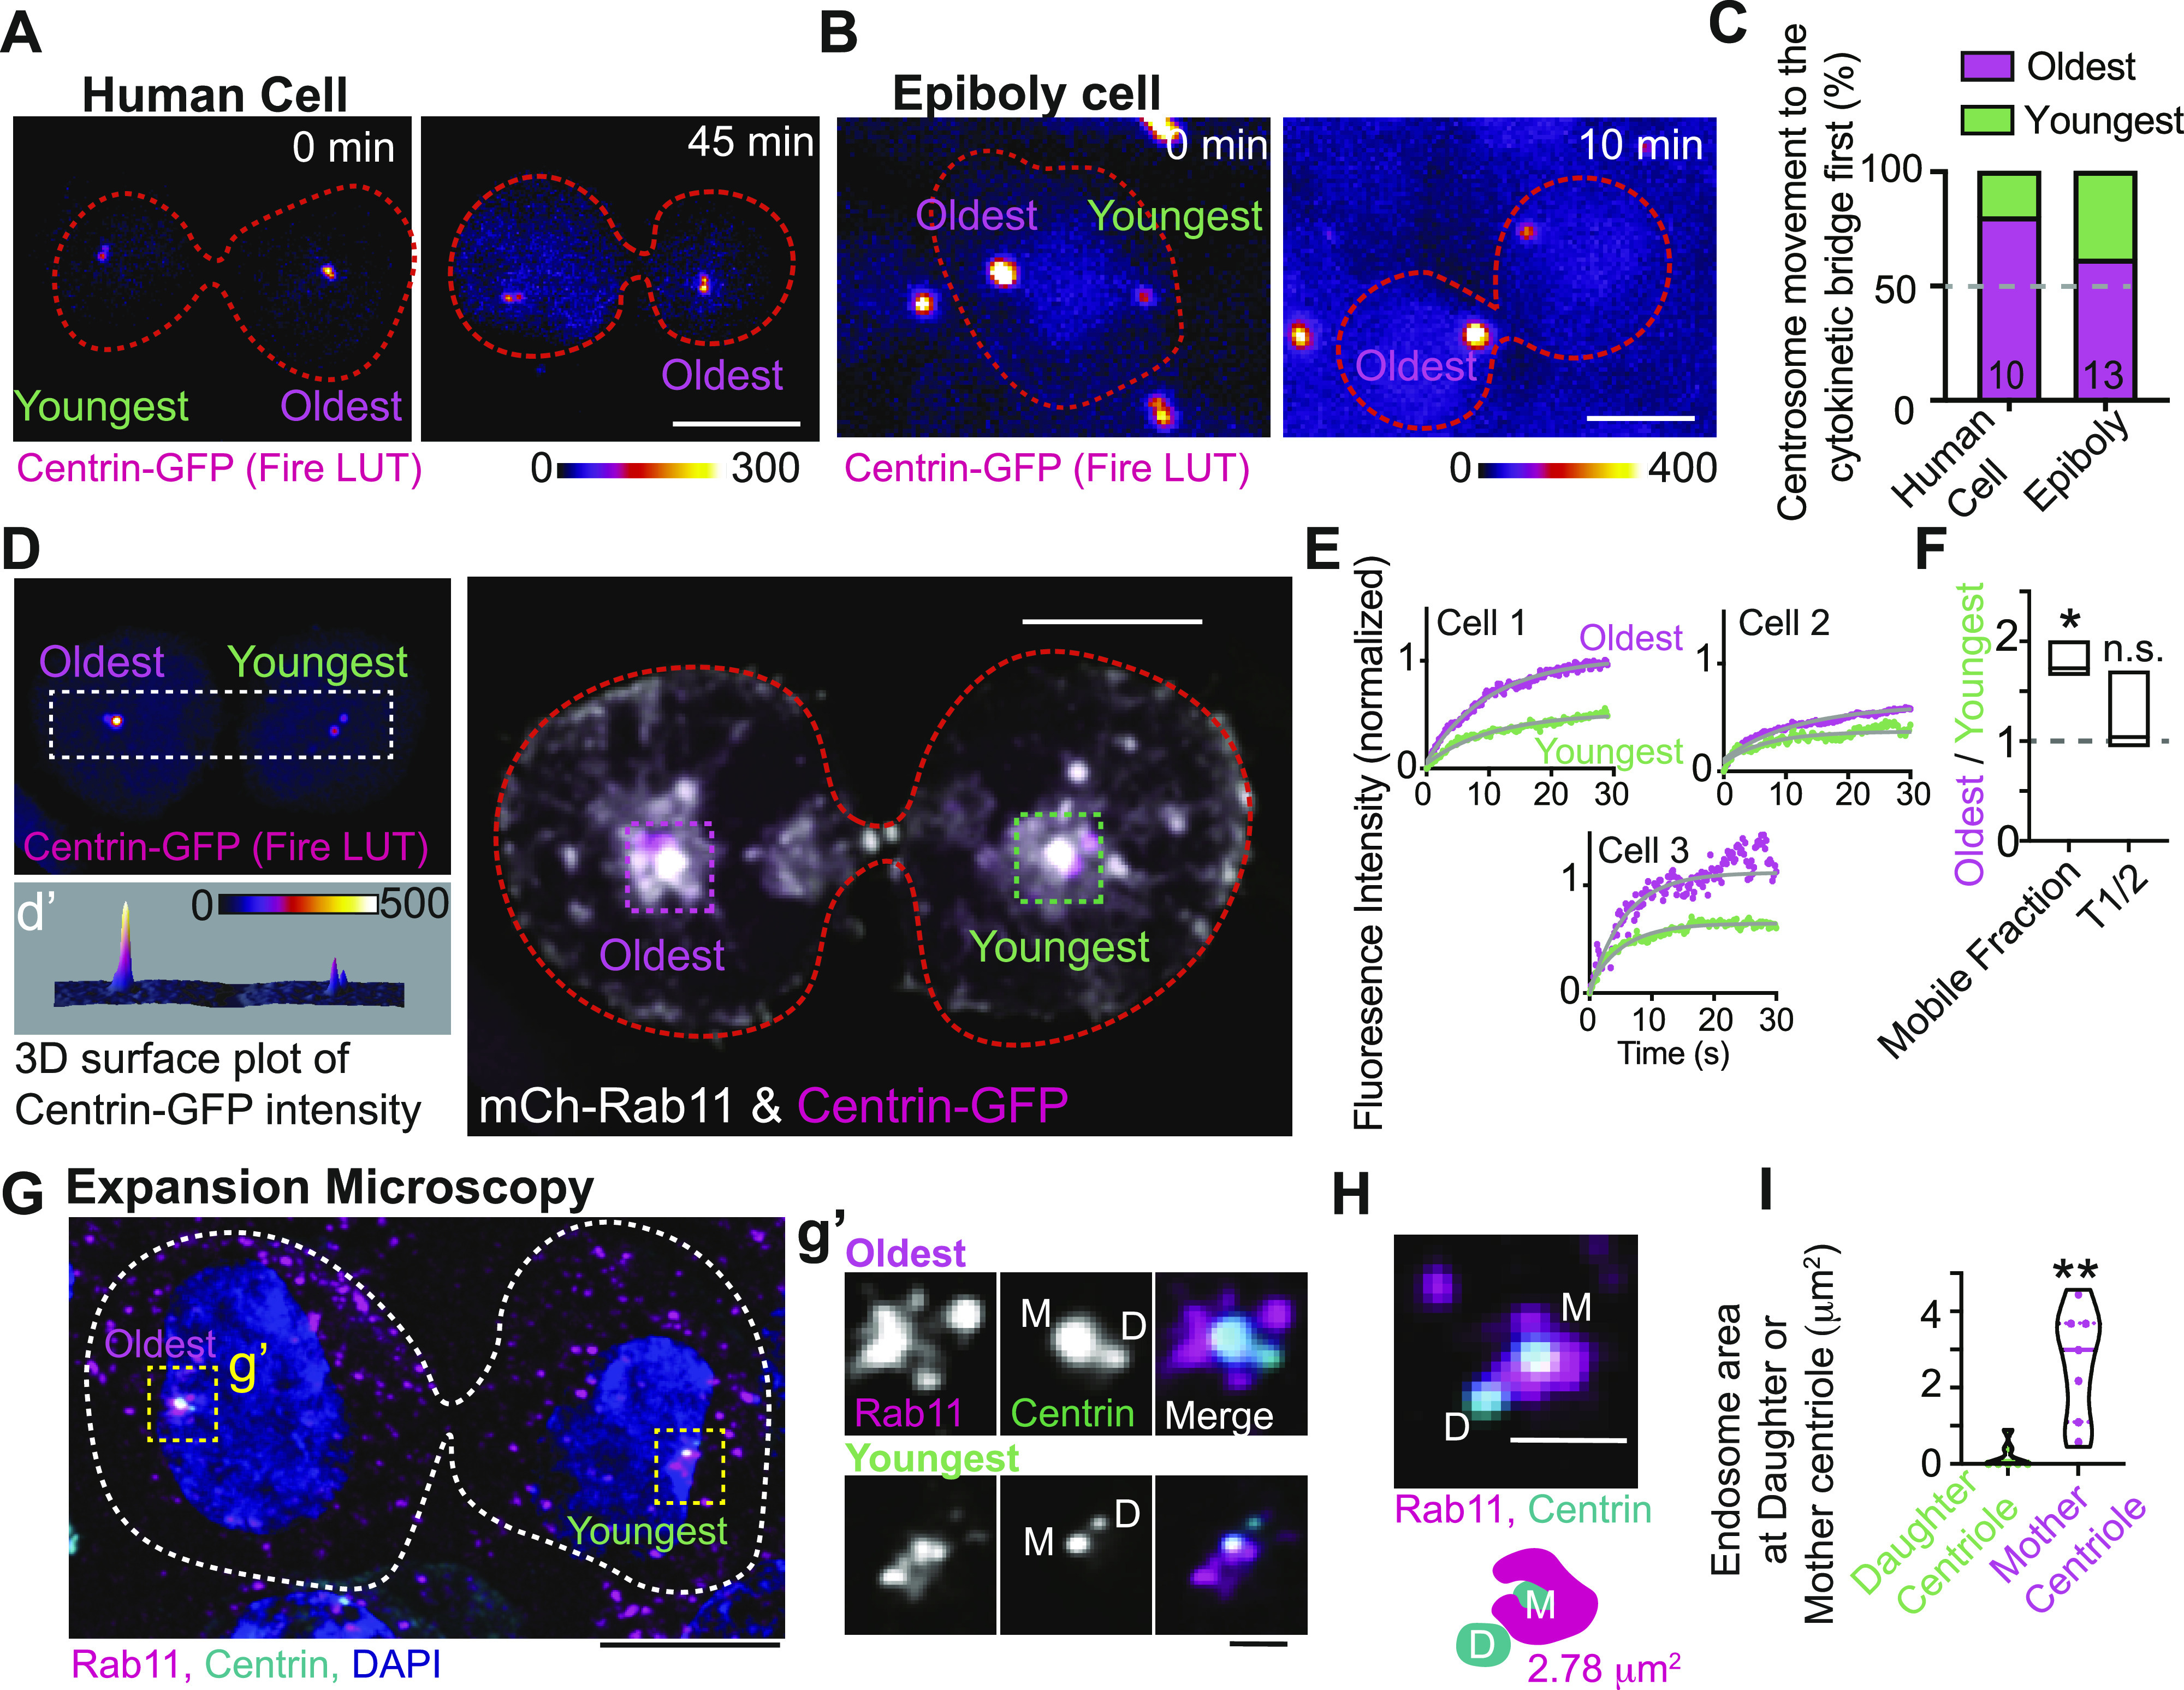
Figure 3. The oldest mitotic centrosome in pre-abscission moves towards the cytokinetic bridge first and has a more dynamic population of Rab11.

(A, B) Time lapse of a pre-abscising human (HeLa) cell (A) and zebrafish embryo cell at epiboly (B), expressing centrin-GFP (fire LUT). Orange dashed lines, cell boundaries. Scale bar, 10 μm. (C) Percentage of daughter cells with centrosome movement towards the cytokinetic bridge in zebrafish embryos and human (HeLa) cells. n-values on graph, Table S1. (D) Pre-abscising human (HeLa) cell expressing centrin-GFP (fire LUT, magenta in merge) and mCh-Rab11 (gray). (d’) Three-dimensional surface plot of centrin-GFP to note oldest and youngest centrosome. Orange dashed lines, cell boundaries. Scale bar 10 μm. (E) FRAP traces of mCh-Rab11 at the oldest mitotic centrosome (magenta) and youngest mitotic centrosome (green) from three cells depicted. (F) mCh-Rab11 mobile fraction and half-life (T1/2) were calculated as a ratio of oldest centrosome/youngest centrosome and presented as a box and whisker plot with mean (dark line). n = 3. Minimum and maximum values noted by the boxed boundaries. n-values and statistical results detailed in Table S1. (G, H) Expanded pre-abscising human (HeLa) cell expressing centrin-GFP (cyan) and immunostained with Rab11 (magenta) and DNA (DAPI, blue). Dashed lines, cell boundaries. Scale bar, 25 μm. (g’) Magnified insets from (G) depicting Rab11 (gray, magenta in merged) and centrin-GFP (gray, cyan in merged). (H) Example pre-abscising expanded cell centrosome with a model below demonstrating Rab11-endosome area at the mother centriole. (g’, H) M, denotes mother centriole and D, denotes daughter centriole. Scale bar, 2.5 μm. (I) Endosome area at daughter or mother centriole from pre-abscising cells quantified and presented as a violin plot with median (thick line) and quartiles (dotted lines), n = 7 centrosomes, across n = 4 cells. Two-tailed t test, **P < 0.01. n-values and statistical results detailed in Table S1.

Acknowledgments
This image is the copyrighted work of the attributed author or publisher, and ZFIN has permission only to display this image to its users. Additional permissions should be obtained from the applicable author or publisher of the image. Full text @ Life Sci Alliance