IMAGE

Fig. 4

ID
ZDB-IMAGE-220327-16
Source
Figures for Jawahar et al., 2022
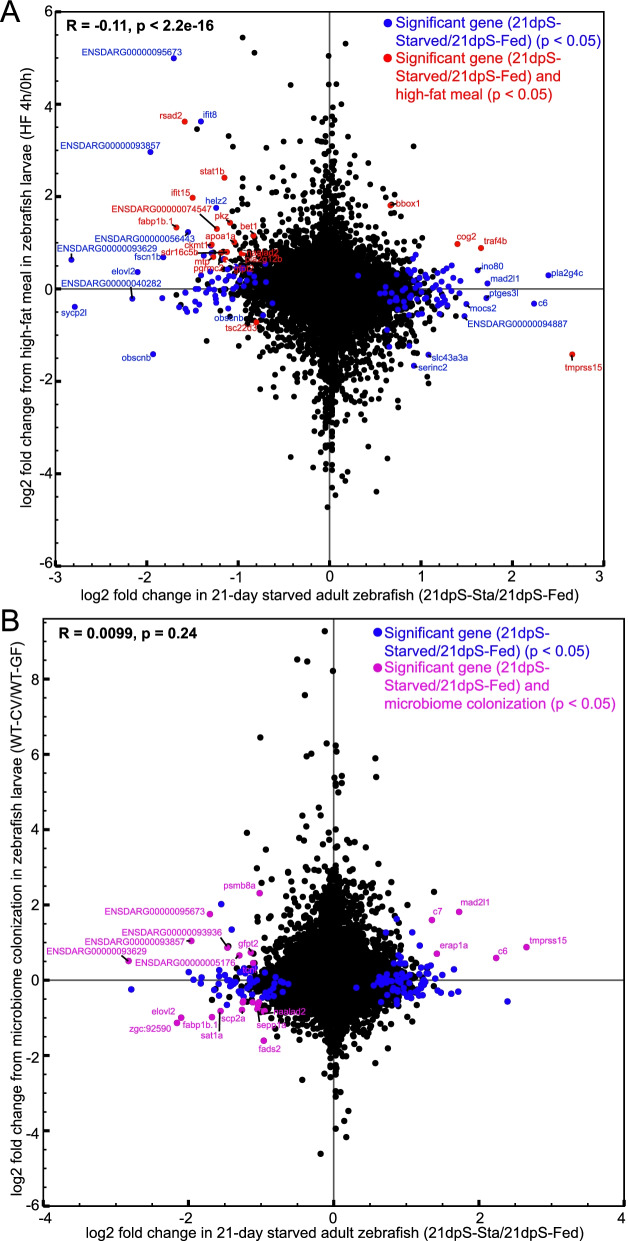
Image
Figure Caption

Fig. 4

Some genes responsive to starvation in the intestine are also responsive to high fat feeding and microbial colonization. A Log2 fold changes for genes from 21dpS (X-axis) plotted according to their log2 fold changes in egg yolk-fed larval zebrafish compared to unfed controls (Y-axis), described in Zeituni et al [59]. Significantly differential genes only in starved zebrafish are plotted in blue, whereas genes significant in both datasets are plotted in red. Pearson’s correlation revealed a significant correlation between the two datasets (p < 0.05). B Log2 fold changes for genes from 21dpS (X-axis) plotted according to their log2 fold changes in zebrafish larvae colonized with a microbiome compared to germ-free controls (Y-axis), described in Davison et al [74]. Genes with significant log2 fold changes only in starved zebrafish are plotted in blue, whereas genes significant in both datasets are plotted in magenta. Pearson’s correlation did not reveal a significant correlation between the two datasets (p > 0.05)

Acknowledgments
This image is the copyrighted work of the attributed author or publisher, and ZFIN has permission only to display this image to its users. Additional permissions should be obtained from the applicable author or publisher of the image. Full text @ BMC Genomics