IMAGE

2

ID
ZDB-IMAGE-220325-22
Source
Figures for Lu et al., 2022
Image
Figure Caption

2 Pharmacological inhibition of mTOR activity impairs RPE regeneration.

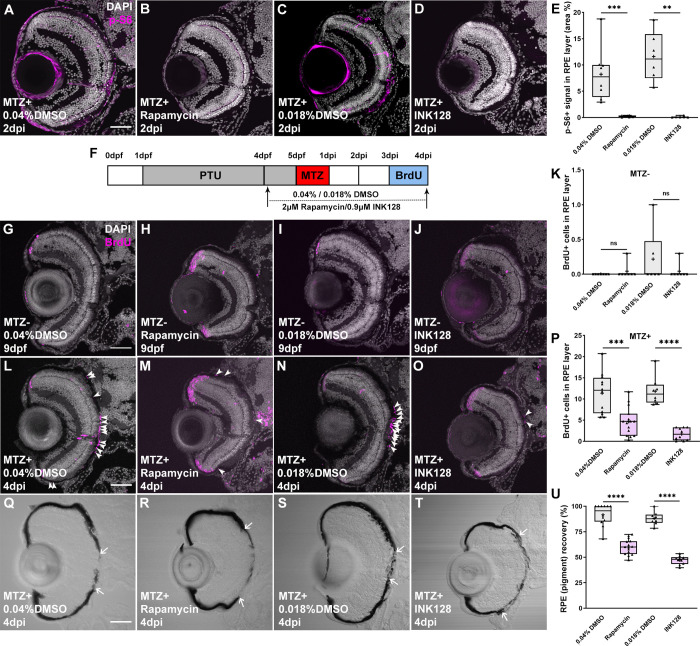
(A-D) Immunofluorescent images of p-S6 staining on transverse cryosections from MTZ+ DMSO-, rapamycin- or INK128-treated larvae at 2dpi. Nuclei (white), p-S6 (magenta) (E) p-S6 levels in the RPE layer were significantly decreased in rapamycin-treated and INK128-treated larvae when compared with DMSO-treated controls. (F) Schematic of the experimental paradigm showing the timeline for chemical treatments and ablation. (G-J) Immunofluorescent images of BrdU staining on transverse cryosections from MTZ- DMSO-, rapamycin- and INK128-treated larvae at 9dpf and (L-O) from MTZ+ DMSO-, rapamycin- or INK128 -treated larvae at 4dpi. White arrowheads indicate BrdU+ cells in the RPE layer. Nuclei (white), BrdU (magenta). (K) Quantification of BrdU+ cells in the MTZ- RPE layer showed no significant differences between DMSO-treated and inhibitor-treated larvae. (P) Quantification of BrdU+ cells in the RPE layer showed significantly fewer BrdU+ cells in MTZ+ rapamycin- and INK128-treated larvae when compared to DMSO-treated controls. (Q-T) Brightfield images of cryosections from MTZ+ DMSO-, rapamycin- or INK128-treated larvae at 4dpi. White arrows indicate the edges of pigment recovery. (U) Quantification of percent RPE recovery showed a significant impairment in pigment recovery in rapamycin- or INK128-treated larvae. p-values: ** ≤ 0.01, ***≤ 0.001, and **** ≤ 0.0001. Statistical information can be found in S9 Table. Dorsal is up and distal is left. Scale bar = 50μm.

Acknowledgments
This image is the copyrighted work of the attributed author or publisher, and ZFIN has permission only to display this image to its users. Additional permissions should be obtained from the applicable author or publisher of the image. Full text @ PLoS Genet.