IMAGE

Fig 1

ID
ZDB-IMAGE-220325-21
Source
Figures for Lu et al., 2022
Image
Figure Caption

Fig 1 The mTOR pathway is activated in the RPE after ablation.

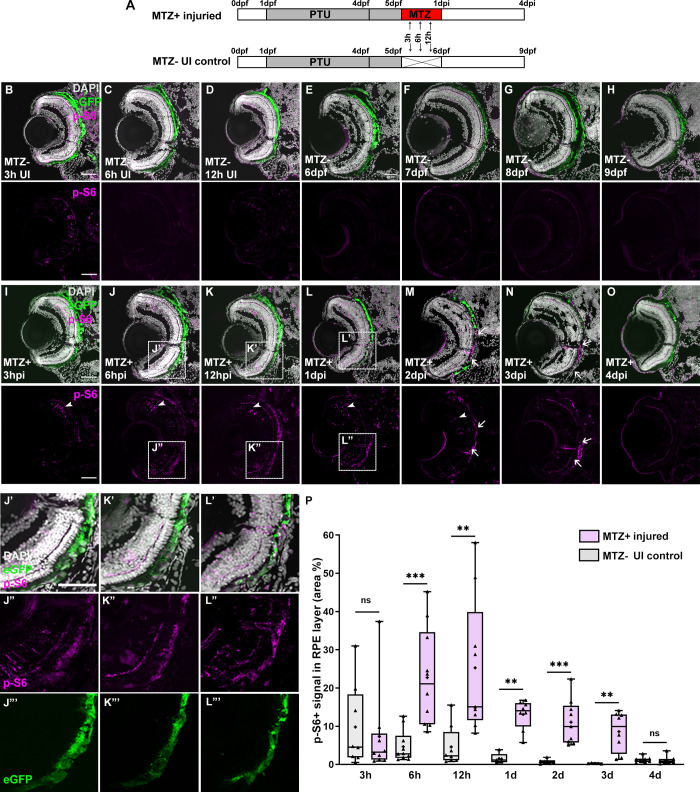
(A) Schematic of the experimental paradigm showing the time points for MTZ ablation and sample collection on transgenic larvae (rpe65a:nfsB-eGFP). (B-H) Immunofluorescent images of p-S6 staining on transverse cryosections from unablated (MTZ) and (I-O) ablated (MTZ+) larvae from 3hpi to 4dpi. White arrows indicate the p-S6+ eGFP- cells in the RPE layer. White arrowheads indicate p-S6+ cells in the retinae. (J’-J”‘) High-magnification images showing the colocalization of p-S6 and eGFP at 6hpi, 12hpi (K’-K”‘) and 1dpi (L’-L”‘). Nuclei (white), eGFP (green), p-S6 (magenta). (P) Quantification of the p-S6+ area in the RPE layer revealed that expression was low in the RPE of unablated larvae but increased significantly in ablated larvae from 3hpi to 3dpi. p-values: ** ≤ 0.01, *** ≤ 0.001. Statistical information can be found in S9 Table. Dorsal is up and distal is left. Scale bar = 50μm.

Acknowledgments
This image is the copyrighted work of the attributed author or publisher, and ZFIN has permission only to display this image to its users. Additional permissions should be obtained from the applicable author or publisher of the image. Full text @ PLoS Genet.