IMAGE

Figure 9.

ID
ZDB-IMAGE-220323-13
Source
Figures for Okada et al., 2022
Image
Figure Caption

Figure 9.

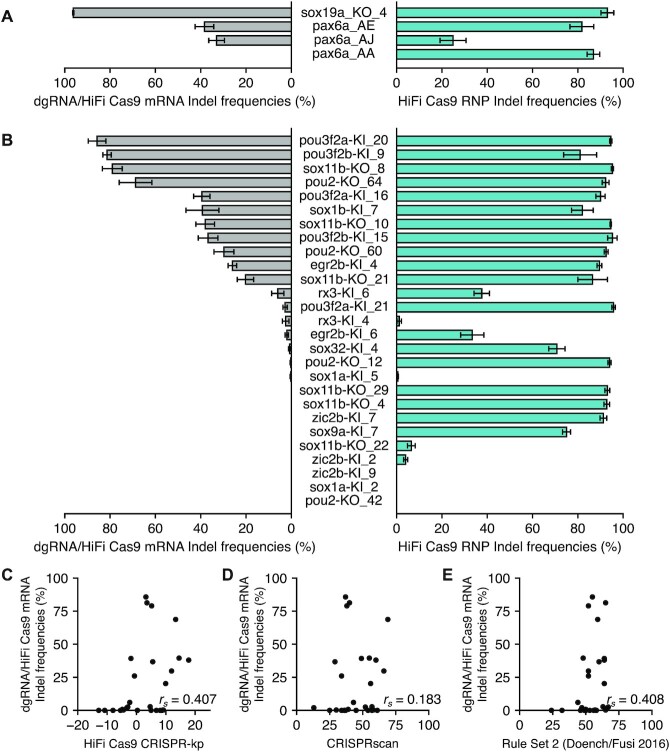
Comparison of dgRNA efficiency between injection of pre-assembled RNP and a dgRNA/Cas9 mRNA mixture. (A) Selected crRNAs from the first set of 51 crRNAs were tested for their activity through injection of 3 fmol dgRNA with 200 pg HiFi Cas9 mRNA. Indel frequencies (in %) assessed with ICE were compared to those obtained with HiFi Cas9 RNP, using bar graphs. Means of replicates are shown with standard error bars. The experimental dataset for dgRNA/Cas9 mRNA mixture is shown in Supplementary Table S9. HiFi Cas9 RNP data were adopted from Figure 2. (B) A second set of 27 crRNAs were tested for their activity through injection of 3 fmol dgRNA with 200 pg HiFi Cas9 mRNA. Indel frequencies (in %) assessed with ICE were compared to those obtained with HiFi Cas9 RNP using bar graphs. Means of replicates are shown with standard error bars. The experimental dataset for dgRNA/Cas9 mRNA mixture is shown in Supplementary Table S9. HiFi Cas9 RNP data were adopted from Supplementary Figure S4. (C−E) Performance of CRISPR-kp on efficiency of 27 crRNAs in dgRNA/HiFi Cas9 mRNA format in comparison with CRISPRscan and Rule Set 2 scores. Indel frequencies (in %) obtained with dgRNA/HiFi Cas9 mRNA were compared to scores obtained with CRISPR-kp (C), CRISPRscan (D) and Rule Set 2 (Doench/Fusi 2016) (E) using scatter plots. Spearman correlation coefficients (rs) are indicated in each panel.

Acknowledgments
This image is the copyrighted work of the attributed author or publisher, and ZFIN has permission only to display this image to its users. Additional permissions should be obtained from the applicable author or publisher of the image. Full text @ Nucleic Acids Res.