
Image
|
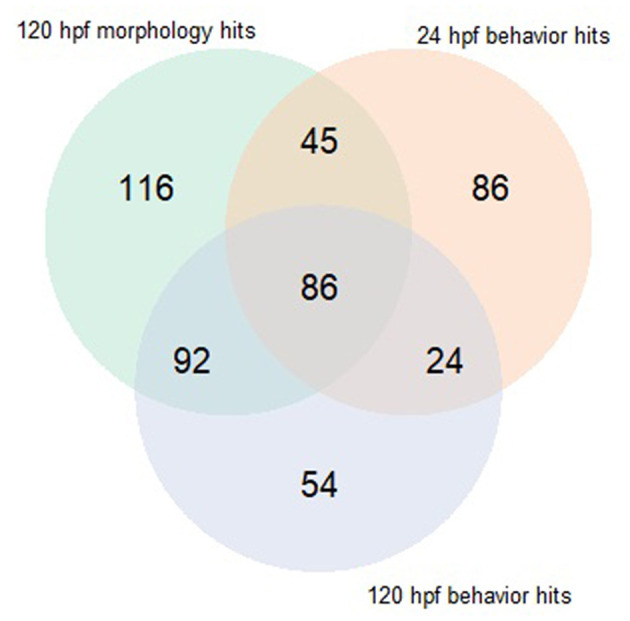
Figure Caption
Figure 5
Venn diagram comparing hits made using behavioral assays when subjected to BMD modeling to those made using morphology screen.
Acknowledgments
This image is the copyrighted work of the attributed author or publisher, and
ZFIN has permission only to display this image to its users.
Additional permissions should be obtained from the applicable author or publisher of the image.
Full text @ Front Toxicol