
Image
|
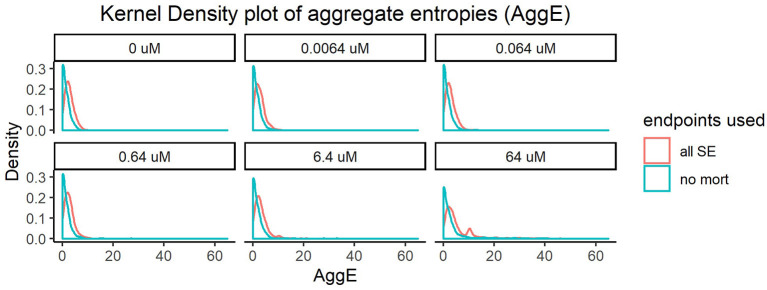
Figure Caption
Figure 1
Kernel density plot of Aggregate entropies (AggE) of 1060 ToxCast chemicals before and after removing mortality information. The density histogram plots AggE on the horizontal axis. The red line represents the distribution of AggE for chemicals obtained by summarizing information from all Super Endpoints (all SE) and the blue line represents AggE of chemicals after excluding data from mortality endpoint.
Acknowledgments
This image is the copyrighted work of the attributed author or publisher, and
ZFIN has permission only to display this image to its users.
Additional permissions should be obtained from the applicable author or publisher of the image.
Full text @ Front Toxicol