
Image
|
Figure Caption
Figure 8
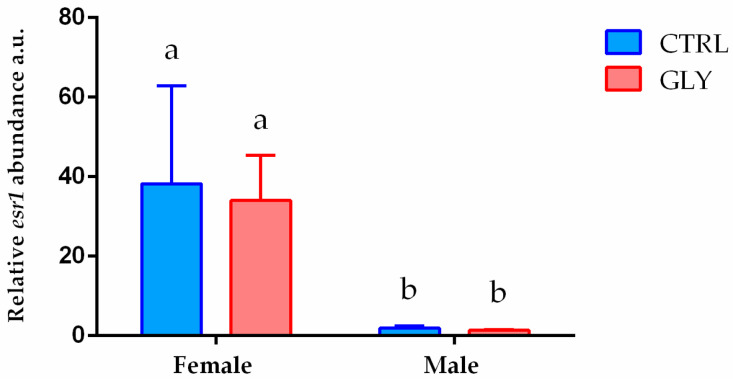
Figure 8. Gene expression profiles of hepatic esr1. esr1 mRNA levels in female and male livers normalized against rplp0 and rplp13 in CTRL and GLY-exposed zebrafish. Data are shown as mean ± SD (n = 5) and were analyzed by two-way ANOVA followed by Tukey’s multiple comparison test. Letters above each column denote significant differences among the experimental groups (p < 0.05).
Acknowledgments
This image is the copyrighted work of the attributed author or publisher, and
ZFIN has permission only to display this image to its users.
Additional permissions should be obtained from the applicable author or publisher of the image.
Full text @ Int. J. Mol. Sci.