
IMAGE
Fig. 3
- ID
- ZDB-IMAGE-220310-8
- Publication
- Del Vecchio et al., 2021 - Leptin receptor-deficient (knockout) zebrafish: effects on nutrient acquisition
- All Figures
- Figures for Del Vecchio et al., 2021
Image
|
Figure Caption
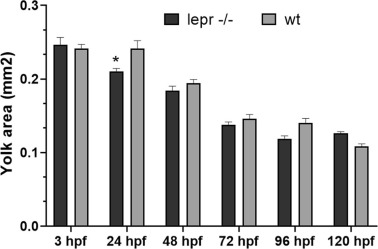
Fig. 3 Comparison of the yolk-sac area between lepr−/− and wt embryos/early larvae from 3 to 120 hpf (endogenous feeding period). Each time-point is the mean of 10–15 embryos (±SE). Two-way ANOVA shows significant effects of developmental age [F (5, 152) = 134.5; p < 0.0001] and genotype [F (1, 152) = 4.748; p < 0.05]. A post-hoc Turkey’s multiple comparison was used to assess specific pairwise differences (* = p < 0.05).
Acknowledgments
This image is the copyrighted work of the attributed author or publisher, and
ZFIN has permission only to display this image to its users.
Additional permissions should be obtained from the applicable author or publisher of the image.
Full text @ Gen. Comp. Endocrinol.