
Figure 2
- ID
- ZDB-IMAGE-220309-13
- Publication
- Banerjee et al., 2022 - Vision and sensorimotor defects associated with loss of Vps11 function in a zebrafish model of genetic leukoencephalopathy
- All Figures
- Figures for Banerjee et al., 2022
|
Figure 2
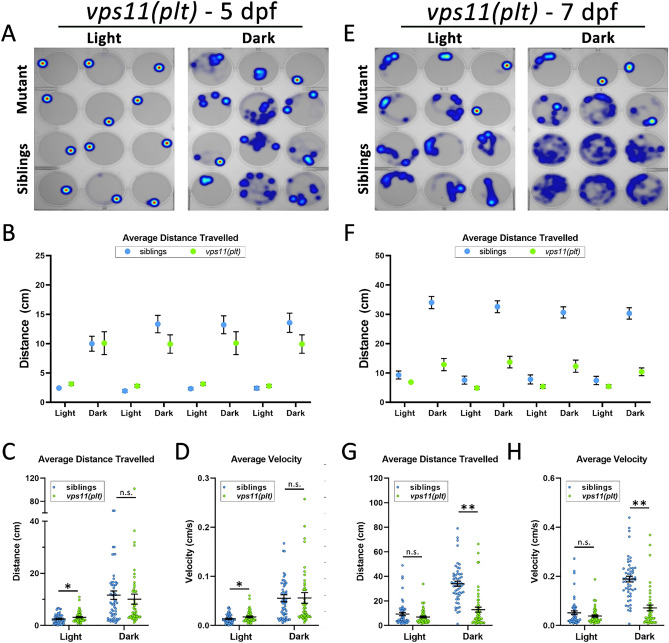
vps11(plt) mutants show normal distance travelled and velocity at 5dpf and significantly reduced distance travelled and velocity at 7dpf during alternating cycles of light and dark. (A) Representative heat maps of total distance moved by individual larvae at 5dpf (vps11(plt) mutants = top two rows; siblings = bottom two rows) during a 3-min period of light and dark. (B) Graph representing average distance travelled in 4 alternating light–dark cycles of 3 min each (sibling larvae in blue; vps11(plt) mutants in green). (C) Graph representing average distance travelled in light and dark periods. (D) Graph representing average velocity of sibling larvae and vps11(plt) in light and dark periods. n = 60 sibling and 60 vps11(plt) larvae at 5 dpf. (E) Representative heat maps displaying total distance moved by individual larvae at 7dpf (vps11(plt) mutants = top two rows; siblings = bottom two rows) during a 3-min period of light and dark. (F) Graph representing average distance travelled by larvae in 4 alternating light–dark cycles of 3 min each (sibling larvae in blue; vps11(plt) mutants in green). (G) Graph representing average distance travelled in light and dark periods. (H) Graph representing average velocity of sibling larvae and vps11(plt) in light and dark periods. n = 54 sibling and 52 vps11(plt) larvae. *P < 0.05, **P < 0.01. Error bars indicate SEM.