
Figure 5.
- ID
- ZDB-IMAGE-220305-3
- Publication
- Ying et al., 2022 - The non-telomeric evolutionary trajectory of TRF2 in zebrafish reveals its specific roles in neurodevelopment and aging
- All Figures
- Figures for Ying et al., 2022
|
Figure 5.
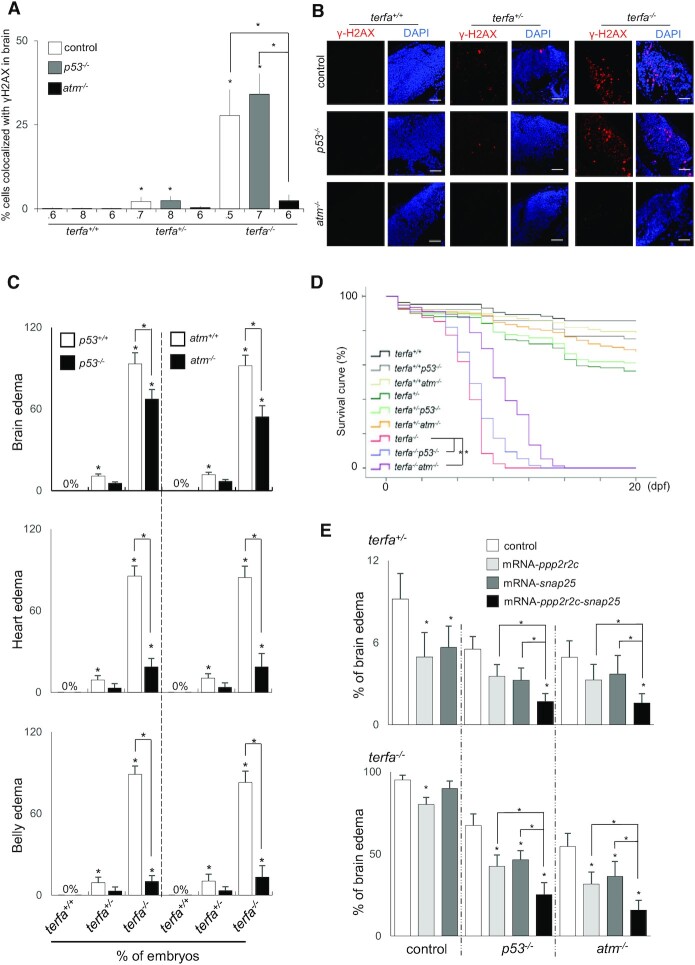
The embryonic neurodevelopmental failure results from both ATM activation and transcriptional dysregulation. (A, B) Representative (B) and quantification (A) of confocal section images of γH2AX foci (red) in the brains of terfa-compromised p53−/− or atm−/− embryos at 3 dpf (scale bars, 30 μm). (C) Percentages of terfa-compromised (terfa+/+, terfa+/−, terfa−/−) embryos with brain edema (left), heart edema (middle) and intestine edema (right) rescued by p53−/− or atm−/−. (D) Survival curve of terfa-compromised p53−/− or atm−/− embryos during development. (E) Percentages of embryos at 3 dpf with brain edema phenotypes after microinjection with the indicated mRNA (ppp2r2c, snap25 or ppp2r2c + snap25) in terfa+/−:p53−/− or terfa+/−:atm−/− (left) and terfa−/−:p53−/− or terfa−/−:atm−/− (right) embryos. All data are shown as the means ± SEM of three biological replicates. Statistical analyses were performed using unpaired two-sided t tests; survival curves were plotted using the log-rank test (*P < 0.05). The number below the graph indicates the total number of tested individual embryos. Asterisks directly above columns indicate a significant difference between the indicated treatment and the control group (left). Asterisks above two columns indicate a significant difference between the two columns.