
|
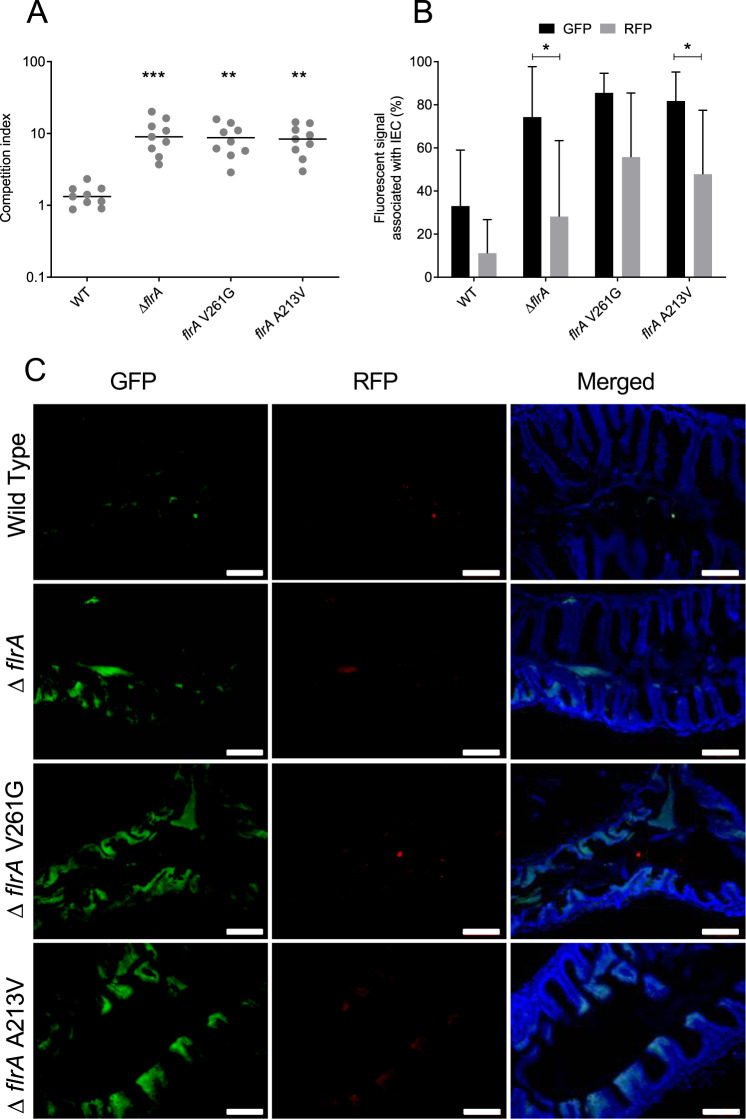
Fig. 5 A CI of adapted isolates with mutations in flrA in zebrafish infection model was calculated by dividing the output ratio of test strain (e.g. flrA mutants) to ∆lacZ after infection corrected by the input ratio. Data are from nine independent biological replicates and are shown as the median. Statistical significance was determined by one-way ANOVA and Kruskal–Wallis test and is indicated by ∗∗∗p < 0.001 and ∗∗p < 0.01. B Quantification of bacterial fluorescence associated with intestinal epithelial cells of zebrafish after infection. Data are presented as percentages of GFP (test strain) and RFP (∆lacZ mutant) signal quantified by fluorescent pixel count of tissue sections in ImageJ. Statistical significance was determined by one-way ANOVA and Tukey’s multiple comparison test and is indicated by ∗p < 0.05. C Colonisation of adapted isolates in adult zebrafish intestine. The four panels show representative fluorescence microscopy images of intestinal epithelial cell of adult zebrafish colonised with the indicated bacteria tagged with GFP and ∆lacZ strain tagged with RFP. Scale bars: 100 µm.