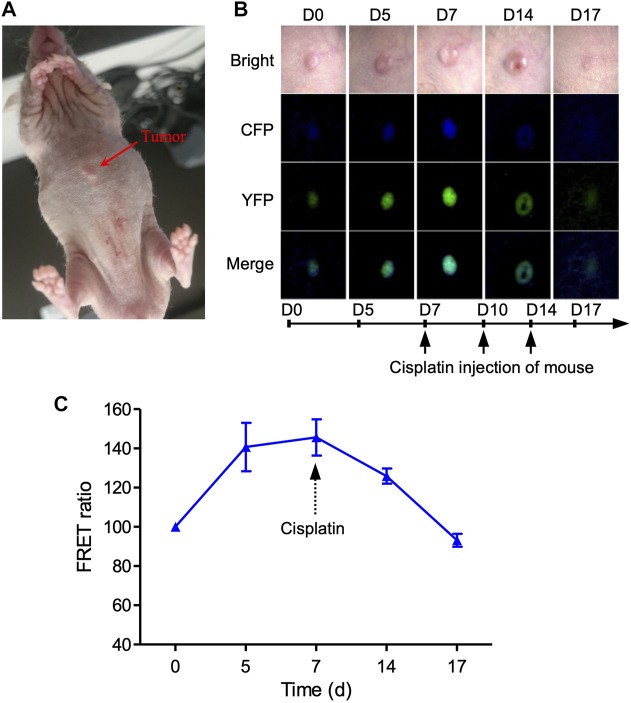
FIGURE 5
Imaging of cell apoptosis in xenograft tumor mouse in vivo. (A) Imaging of 231-C3 xenograft nude mice and FRET channels of a tumor with no drug treatment. 100 µL 5×10⁶/ml 231-C3 cells were injected into each site of nude mice. Mice were injected with 6 mg/kg cisplatin after the establishment of the tumor xenograft. (B) Imaging of 231-C3 xenograft tumor nude mice with cisplatin treatment. (C) Quantification of FRET ratio in xenograft nude mice tumors after 6 mg/kg cisplatin treatment. In vivo imaging of mouse tumor was performed using a Leica fluorescent microscope. CFP (ex: 440 nm; em: 480 nm), YFP (ex: 440 nm; em: 535 nm). Data are expressed as mean ± s.e.m. n = 3.