IMAGE

FIGURE 4

ID
ZDB-IMAGE-220303-33
Source
Figures for DiNapoli et al., 2022
Image
Figure Caption

FIGURE 4

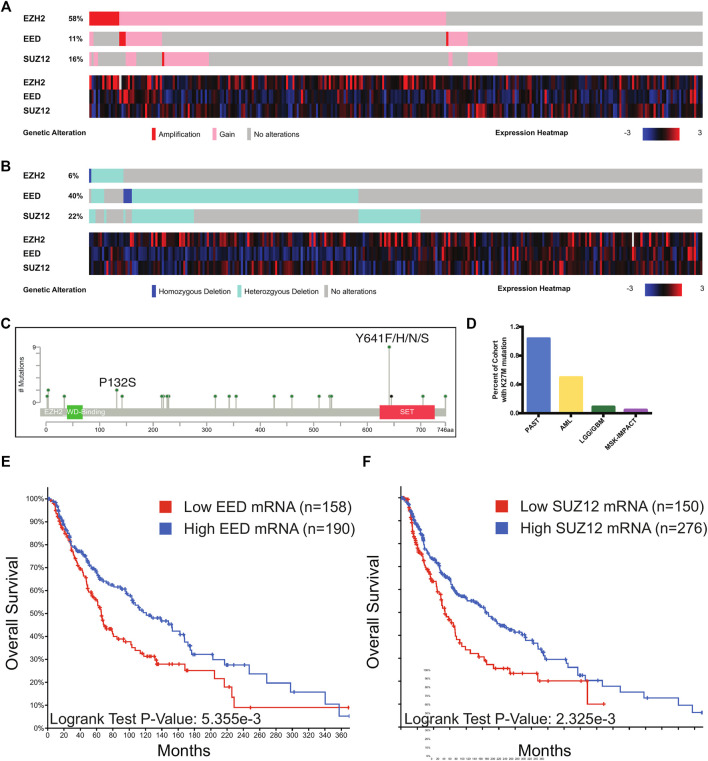
PRC2 alterations in melanoma. (A,B) Oncoprint output of TCGA melanoma data from cBioPortal. Top, chromosomal alterations in PRC2 components are shown. Below, heatmap with mRNA levels of PRC2 components. (C) Lollipop plot of mutations in EZH2. Recurrent mutations with known effects on catalytic activity are denoted. (D) Percentage of cases from TCGA cohorts with the K27M mutation in any H3 gene. PAST, pilocytic astrocytoma; AML, acute myeloid leukemia; LGG/GBM, low-grade glioma/glioblastoma. Of the five MSK-IMPACT cases, n = 1 diffuse intrinsic pontine glioma; n = 1 glioma; n = 1 high-grade glioma; n = 1 glioblastoma; n = 1 primary melanoma. (E,F) Stratification of survival of human melanoma patients based on EED (E) and SUZ12 (F) mRNA levels in TCGA melanoma cases with expression data. Cases with low EED expression have mRNA expression less than 0.6 standard deviations below the mean. Cases with low SUZ12 expression have mRNA expression less than 0.5 standard deviations below the mean. Plots generated with cBioPortal. p-value calculated from the Log-Rank Test.

Acknowledgments
This image is the copyrighted work of the attributed author or publisher, and ZFIN has permission only to display this image to its users. Additional permissions should be obtained from the applicable author or publisher of the image. Full text @ Front Cell Dev Biol