IMAGE

FIGURE 3

ID
ZDB-IMAGE-220303-32
Source
Figures for DiNapoli et al., 2022
Image
Figure Caption

FIGURE 3

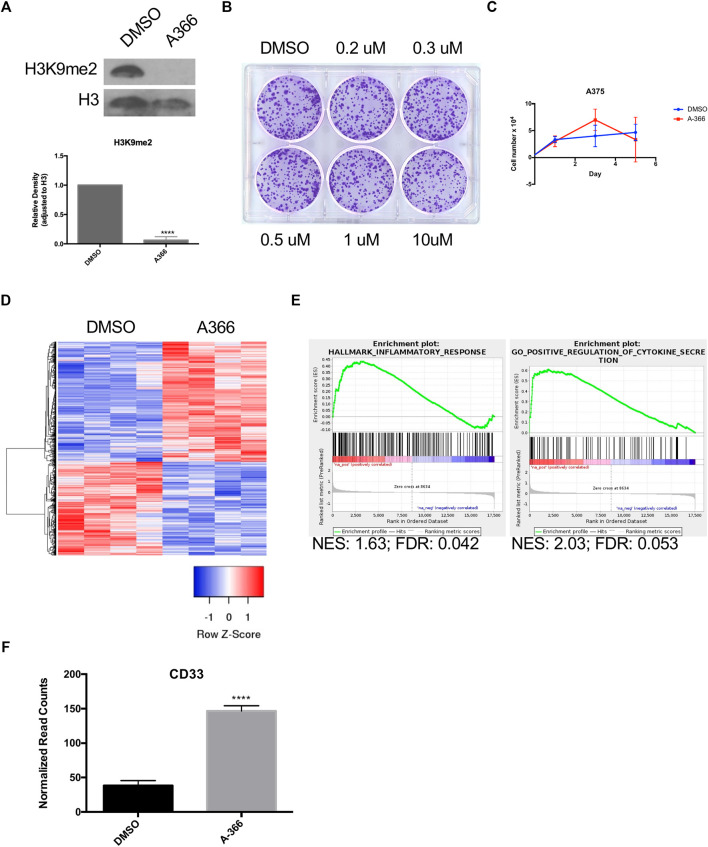
A-366 induces inflammatory response with no effect on cellular growth. (A) Western blot of acid-extracted histones from A375 cells incubated with either DMSO or 0.2 µM A-366 for 48 h. Densitometry analysis from four independent experiments. (B) A375 cells were treated with the indicated concentrations of A-366 for 10 days and assessed for colony formation. (C) Cell growth analysis of A375 cells treated with DMSO or A-366 (n = 3). (D) Top 100 differentially expressed genes between DMSO and A-366 treated cells (sorted by p-value adjusted). (E) GSEA plot showing enrichment in A-366 treated cells. (F) RNA seq normalized counts for CD33 in sorted cells (n = 4). (p < 0.0001).

Acknowledgments
This image is the copyrighted work of the attributed author or publisher, and ZFIN has permission only to display this image to its users. Additional permissions should be obtained from the applicable author or publisher of the image. Full text @ Front Cell Dev Biol