IMAGE

FIGURE 2

ID
ZDB-IMAGE-220303-31
Source
Figures for DiNapoli et al., 2022
Image
Figure Caption

FIGURE 2

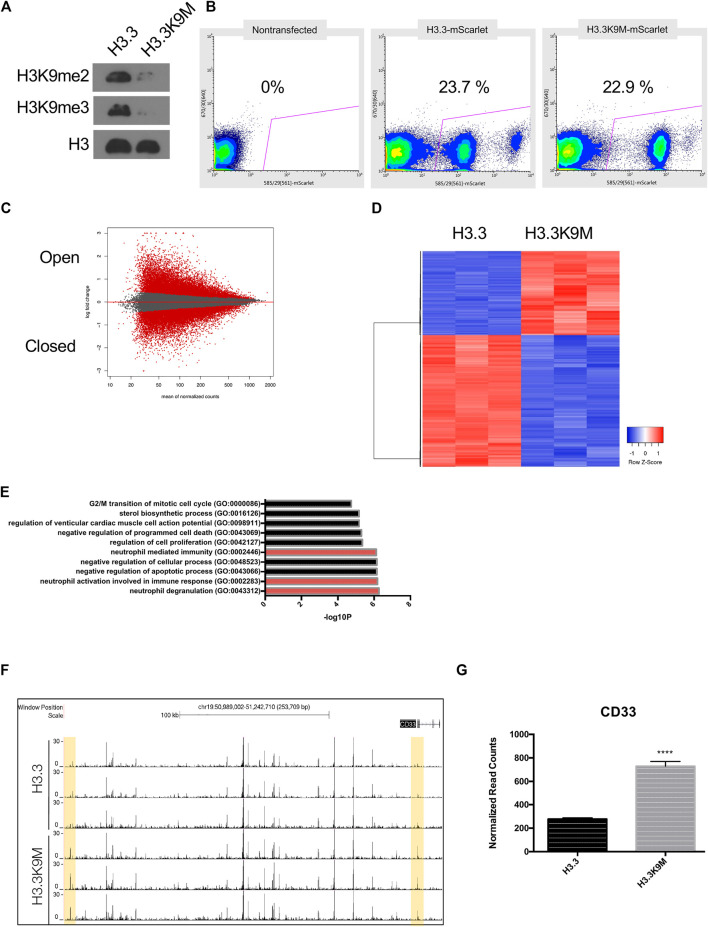
H3.3K9M induces interferon response. (A) Western blot of acid-extracted histones in A375 cells expressing H3.3 WT or H3.3K9M transgenes. (B) Percentage of mScarlet+ cells sorted from a heterogeneous H3.3-mScarlet and H3.3K9M-mScarlet cell population using non-transfected cell as mScarlet control. (C) MA plot of H3.3K9M vs H3.3 (Peaks that change at FDR <0.01 are colored red). (D) Top 1000 differentially expressed genes between H3.3-mScarlet and H3.3K9M-mScarlet (sorted by p-value adjusted). (E) Plot displaying Enriched signatures in H3.3K9M expressing A375 cells. Plot generated by GO Biological Process 2018 Enrichr (Mi et al., 2013). (F) ATAC-seq peaks that are differentially more accessible in H3.3K9M cells. (G) RNA seq normalized counts for CD33 in sorted cells (n = 4), (p < 0.0001).

Acknowledgments
This image is the copyrighted work of the attributed author or publisher, and ZFIN has permission only to display this image to its users. Additional permissions should be obtained from the applicable author or publisher of the image. Full text @ Front Cell Dev Biol