IMAGE

FIGURE 1

ID
ZDB-IMAGE-220303-30
Source
Figures for DiNapoli et al., 2022
Image
Figure Caption

FIGURE 1

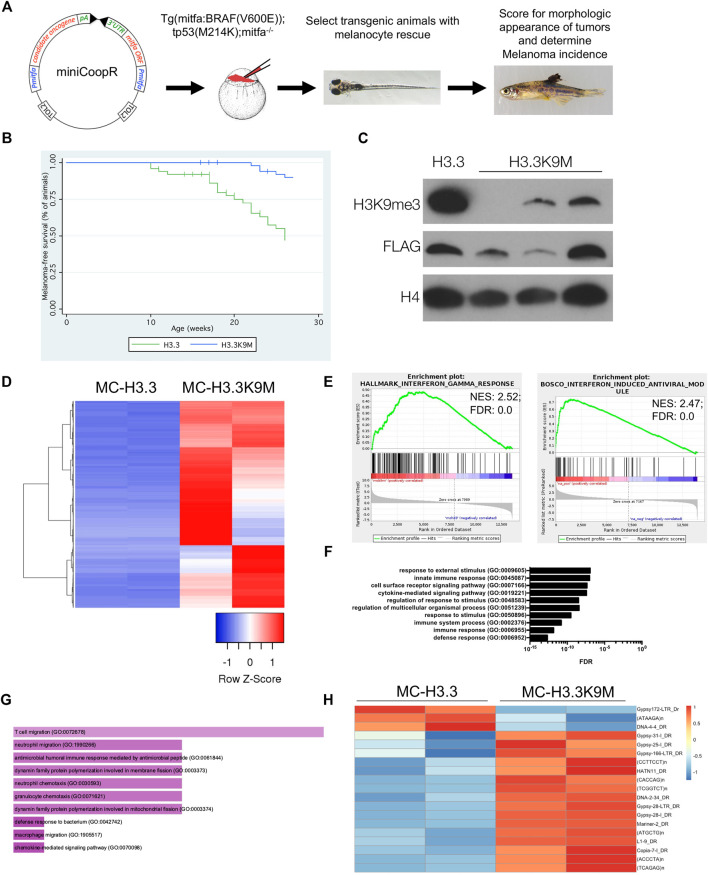
H3.3K9M suppresses melanoma formation. (A) The miniCoopR vector strategy overexpressing candidate genes in a melanocyte-specific fashion. Schematic adapted from Ceol et al. (2011). (B) Kaplan-Meier survival curves of Tg(mitfa:BRAF(V600E)); tp53zdf1/zdf1; mitfaw2/w2 zebrafish injected with indicated miniCoopR constructs (p value = 1.81e−06 calculated from log-rank test between miniCoopR H3.3 and H3.3K9M; 12 miniCoopR H3.3 and four H3.3K9M animals were censored from the study). (C) Western blot of acid-extracted histones from established tumors demonstrates a global loss of H3K9me3. (D) Top 1000 differentially expressed genes between miniCoopR H3.3 and H3.3K9M (sorted by p-value adjusted). (E) GSEA plots with enriched signatures in H3.3K9M tumors displaying enrichment for interferon responses. (F) Panther gene ontology analysis of the top 250 upregulated gene transcripts by p-value. (G) FishEnrichr analysis of the top 250 upregulated gene transcripts by p-value reveals neutrophil pathways among top 10 GO biological processes (Chen et al., 2013; Kuleshov et al., 2016). H, 16 of 19 transposable elements upregulated in H3.3K9M tumors.

Acknowledgments
This image is the copyrighted work of the attributed author or publisher, and ZFIN has permission only to display this image to its users. Additional permissions should be obtained from the applicable author or publisher of the image. Full text @ Front Cell Dev Biol