
|
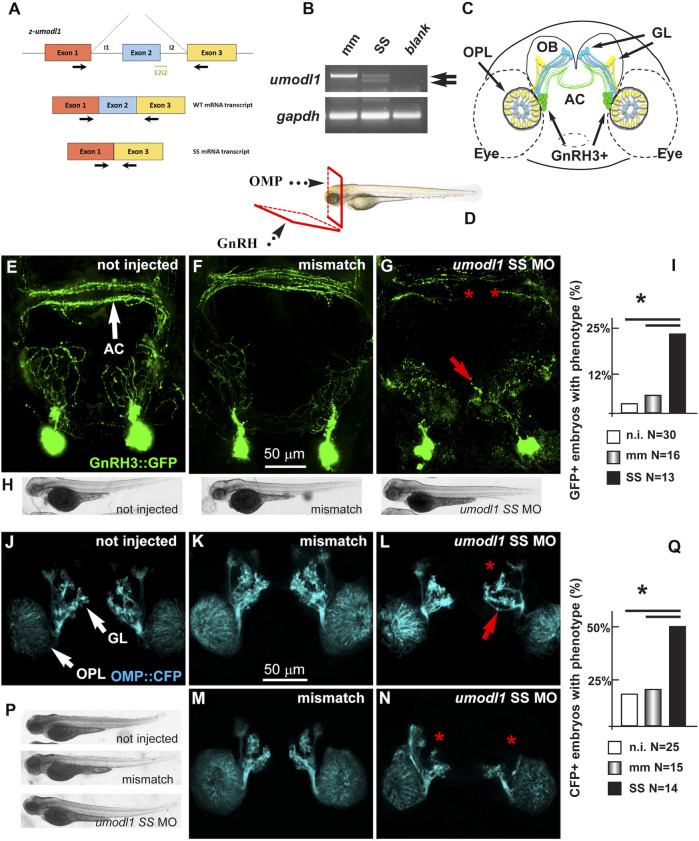
FIGURE 8
Depletion of z-umodl1 affects fasciculation, trajectory, and connectivity of GnRH3+ and OMP + neurons of the zebrafish olfactory system. (A). Scheme of exon/intron junctions of the z-umodl1 gene. The normal splicing is shown on the top, the abnormal splicing due to the Splice-Site (SS) MO is on the bottom. This altered splicing leads to a frame-shift mutation. Black arrows indicate the primers used for the mRNA analysis to detect the aberrant splicing.(B). RT-PCR analysis of RNA from mismatch and SS MO-injected embryos, amplified with the primers indicated in panel a. In the sample from SS MO-treated embryos an additional band lacking exon 2 is evident that is not present in the control sample. The z-gapdh mRNA was also detected for reference. (C). Scheme showing the positions of the GnRH3:GFP + neurons (in green), the OMP: CFP + neurons (in blue) and the Trcp2: Venus + neurons (in yellow, not used in this study) relative to the eyes, the olfactory placodes (OPL), the olfactory bulbs (OB) and the olfactory nerves, in a frontal view. The anterior commissure (AC) is shown at the basis of the OB. (D). Scheme illustrating the view planes for the images of the GnRH + neurons (anterior-ventral) and for the OMP + neurons (frontal). GL, Glomeruli. (E–G). Micrographs of gnrh3:GFP zebrafish embryos that were either not injected (D) or injected with the control mismatched MO (E) or with anti-z-umodl1 SS (F) MO. In control injected embryos, no significant alteration was observed compared to not injected. White arrows indicate the normal position of the GFP + neurons. Red arrows and asterisks indicate, respectively, misrouted GFP + fibers and altered fasciculation or absent fibers. (H). Whole-mount bright field micrographs of embryos corresponding to the micrographs above, showing normal embryonic morphology and growth.
(I). Quantification of the observed phenotype (altered fasciculation/trajectory), expressed as a percent of the injected GFP + embryos showing the indicated phenotype, over the total number of GFP + embryos examined. Open boxes, not injected; grey-shaded boxes, mismatch MO; solid black boxes, anti-z-umodl1 SS MO. * indicates p < 0.05
(J–L). Micrographs of omp:CFP zebrafish embryos either not-injected (i), injected with the control mismatch MO (j) or injected with anti-z-umodl1 SS (K) MO at 400 μM concentration. In control injected embryos, no significant alteration was observed compared to not injected. White arrows indicate the normal position of the olfactory placode (OPL) and of the glomeruli (GL). Red arrows and asterisks indicate, respectively, misrouted or mis-fasciculated OMP + fibers and absent glomeruli. (M, N). Same as in i-k, but the anti-z-umodl1 control and SS (m and n) MO were used at 800 μM concentration. (P). Whole-mount bright field micrographs of embryos corresponding to the micrographs in j-n, showing normal embryonic morphology and growth. (Q). Quantification of the observed phenotypes (altered trajectory/glomerulogenesis), expressed as a percent of the injected CFP + embryos showing the indicated phenotype, over the total number of CFP + embryos examined. Open boxes, not injected; grey-shaded boxes, mismatch MO; solid black boxes, anti-z-umodl1 SS MO. *p < 0.05.