
FIGURE 5
- ID
- ZDB-IMAGE-220303-2
- Publication
- Demirci et al., 2022 - Brain Regeneration Resembles Brain Cancer at Its Early Wound Healing Stage and Diverges From Cancer Later at Its Proliferation and Differentiation Stages
- All Figures
- Figures for Demirci et al., 2022
|
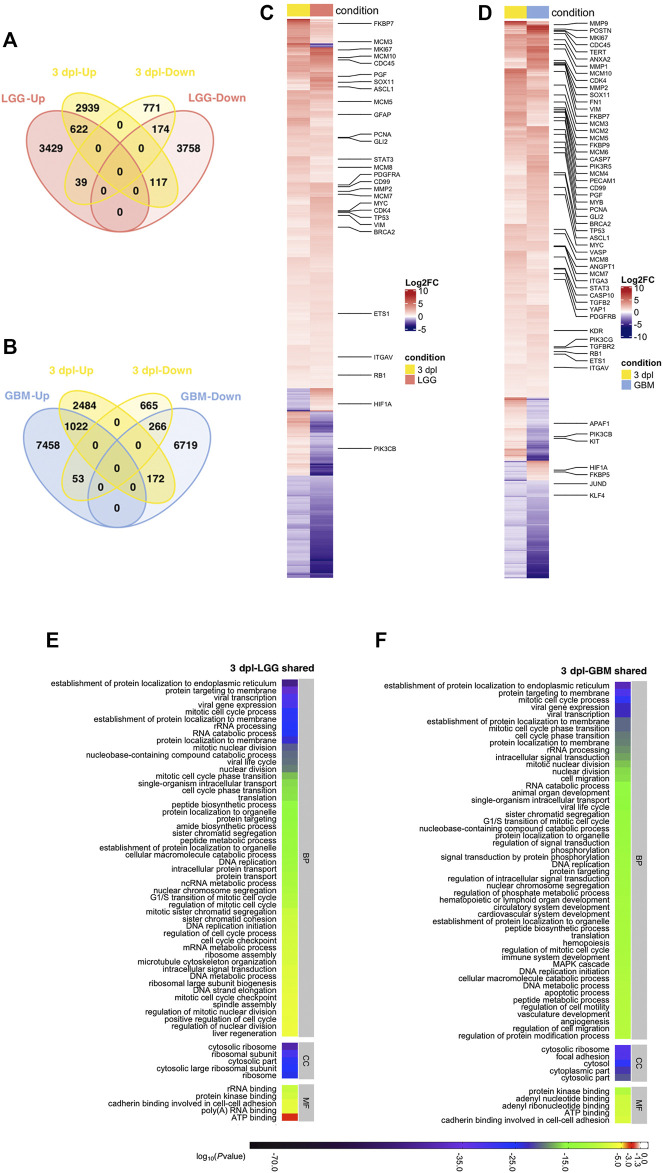
FIGURE 5
Early proliferative stage (3 dpl) of brain regeneration resembles brain cancer with regard to activation of cell proliferation. (A,B) Venn diagrams showing the number of upregulated (Up) or downregulated (Down) DEGs and the overlap between 3 dpl (yellow) and (A) LGG (pink) and (B) GBM (blue). (C,D) Heatmaps showing the expression of genes shared between 3 dpl (yellow) and (C) LGG (pink) and (D) GBM (blue). Each column represents a condition (3 dpl, LGG or GBM) and each row shows a single gene. The scale bar shows log2 fold changes from high to low regulation, represented by a color gradient from red to purple, respectively. (E,F) DAVID was used to show the most significantly enriched GO-BP (top 50), CC (top 5), and MF (top 5) terms based on transcriptional changes in comparison of 3 dpl with (E) LGG and (F) GBM by using human identifiers of shared DEGs. The heatmap scale shows log10 of the ease p-values for the most significantly enriched GO terms. dpl: days post-lesion, DAVID: database for Annotation, Visualization and Integrated Discovery, GO: Gene Ontology, BP: Biological Process, MF: Molecular Function, CC: Cellular Component, dpl: days post lesion, LGG: low-grade glioma, GBM: glioblastoma.