
Image
|
Figure Caption
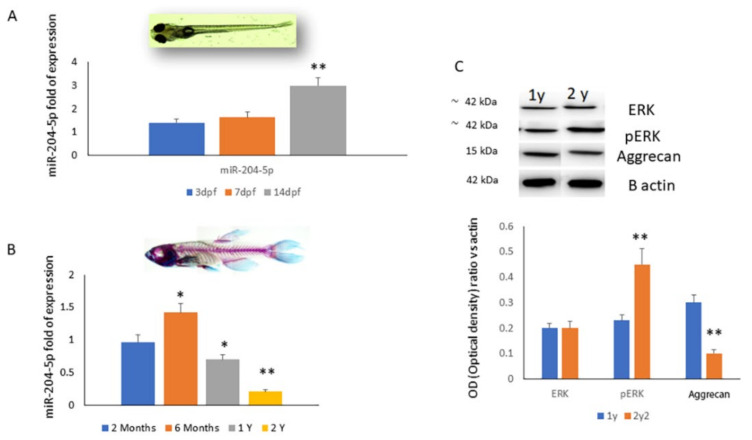
Figure 3
miR-204-5p mRNA expression levels quantified by RT-PCR during (A) embryogenesis (3, 7 and 14 days post fecundation (dpf)) and (B) aging (2 and 6 months, 1 and 2 years old) in a zebrafish larvae in vivo model. (C) ERK, pERK and aggrecan protein levels assessed by western blot (top) and quantified as a relative optical density ratio vs. B-actin (down) on protein lysates from a zebrafish larvae in vivo model. (* p < 0.05; ** p < 0.005 vs. expression levels of larvae after 3 (dpf) (A,B) and vs. 1 year old (C)).
Acknowledgments
This image is the copyrighted work of the attributed author or publisher, and
ZFIN has permission only to display this image to its users.
Additional permissions should be obtained from the applicable author or publisher of the image.
Full text @ Int. J. Mol. Sci.