
|
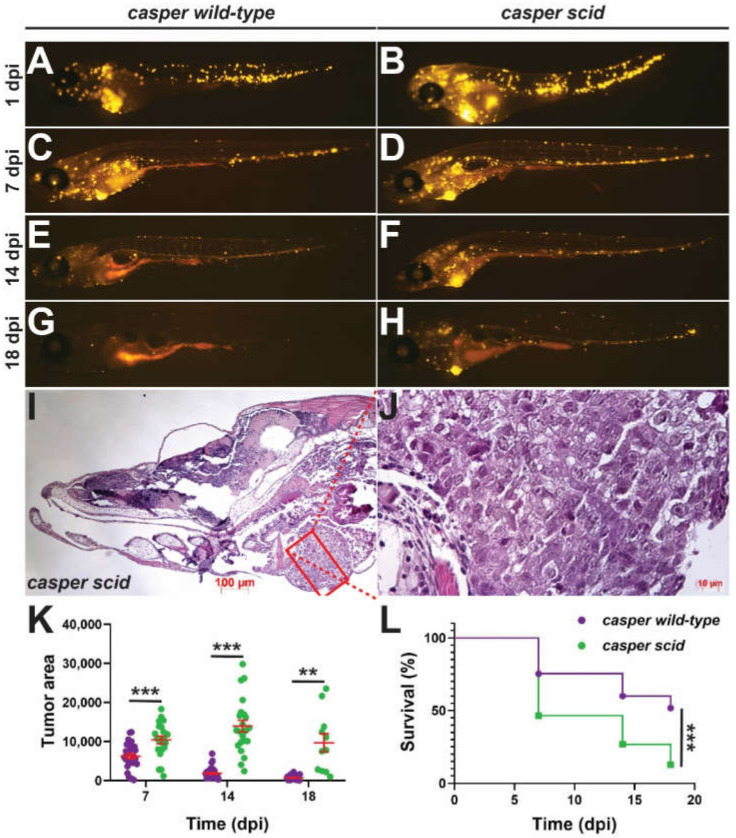
Figure 4
Effect of Il-2rγc.a ablation on tumor immunity. (A–H) Representative casper fish harboring il2rgawt/wt (casper wild-type) (A,C,E,G) or il2rgamdu2/mdu2 (casper scid) (B,D,F,H) injected with fluorescently-labeled human HCT116 colorectal cancer cells imaged at the indicated days post injection (dpi). (I–I’. Histology of a representative tumor from a casper scid fish at 18 dpi at low magnification (5×, I) and of the boxed area at high magnification (40×, J). (K) Quantitation of tumor area showing results for individual embryos, with mean and SEM in red. (L) Kaplan–Meier survival curve of transplanted fish. For panels (K–L), statistical significance is indicated (**: p < 0.01, ***: p < 0.001, n = 11–24).