
|
Figure 1
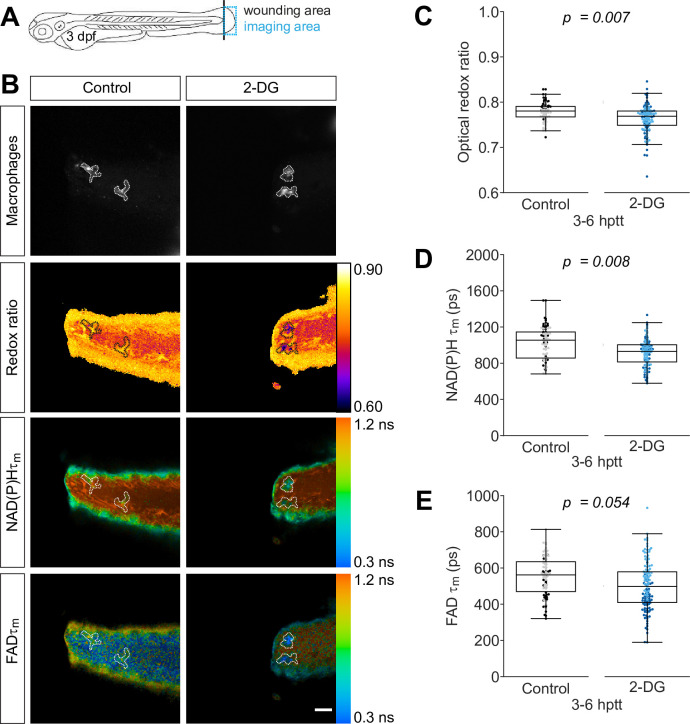
Tail fin transection distal to the notochord was performed using transgenic zebrafish larvae (Tg(mpeg1:mCherry-CAAX) that labels macrophages in the plasma membrane with mCherry) at 3 days post fertilization, and autofluorescence imaging of nicotinamide adenine dinucleotide (phosphate) (NAD(P)H) and flavin adenine dinucleotide (FAD) was performed on live larvae at 3–6 hr post tail transection (hptt) that were either untreated (control) or treated with 5 mM 2-deoxy-d-glucose (2-DG) (glycolysis inhibitor) for 1 hr prior to imaging. (A) Schematic showing the area where wounding (black line) and imaging (blue box) were performed. (B) Representative images of mCherry (to show macrophages), optical redox ratio, and NAD(P)H and FAD mean lifetimes () are shown; macrophages in mCherry channel were outlined with dashed lines and the area was overlaid in the optical redox ratio and lifetime images to show corresponding location; scale bar = 50 µm. Quantitative analysis of (C) optical redox ratio, (D) NAD(P)H and (E) FAD mean lifetimes () from two biological repeats (control = 90 cells/9 larvae, 2-DG = 123 cells/9 larvae) is shown; quantitative analysis of associated individual lifetime endpoints () and sample size for each repeat are included in Figure 1—figure supplement 1. The optical redox ratio and were log transformed prior to analysis. p values represent statistical analysis of the overall effects. Estimated means with 95% CI and overall effects with p values are included in Figure 1—source data 1.
Inhibition of glycolysis reduces the optical redox ratio of macrophages following simple transection.