
IMAGE
Figure 3
- ID
- ZDB-IMAGE-220302-201
- Publication
- Confino et al., 2022 - A Zebrafish Model for a Rare Genetic Disease Reveals a Conserved Role for FBXL3 in the Circadian Clock System
- All Figures
- Figures for Confino et al., 2022
Image
|
Figure Caption
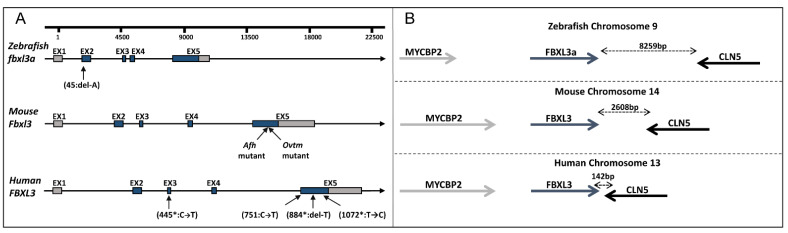
Figure 3
FBXL3 genomic region in humans, mice and zebrafish. (A) Schematic representation of FBXL3 gene arrangement. Untranslated and coding regions are depicted as grey and blue boxes, respectively; introns are depicted as lines. The position of reported mutations in zebrafish (this study), mouse (Afh and Ovtm [6,8]) and humans (*Ansar et al. [10], and this study) are indicated. (B) Illustration of FBXL3 conserved synteny with adjacent genes. Bidirectional arrows indicate the physical distance between nearby genes.
Acknowledgments
This image is the copyrighted work of the attributed author or publisher, and
ZFIN has permission only to display this image to its users.
Additional permissions should be obtained from the applicable author or publisher of the image.
Full text @ Int. J. Mol. Sci.