
|
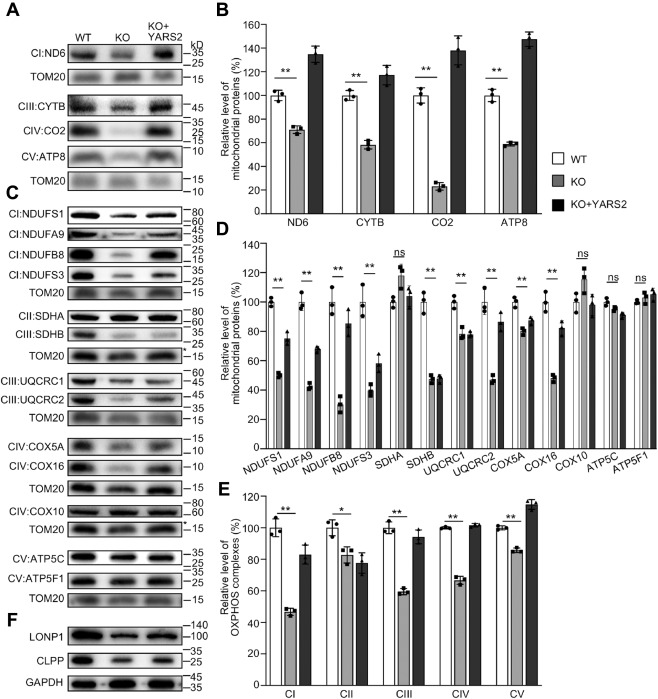
Fig. 2 Western blotting analysis of mitochondrial proteins. A and C, twenty micrograms of total cellular proteins from various cell lines was electrophoresed through a denaturing polyacrylamide gel, electroblotted, and hybridized with antibodies for 17 subunits of OXPHOS (4 encoded by mtDNA and 13 encoded by nuclear genes), and TOM20 as a loading control, respectively. B and D, quantification of mitochondrial proteins: four mtDNA-encoding subunits (B) and 13 nucleus-encoding subunits (D). Average relative each polypeptide content per cell was normalized to the average content per cell of Tom20 in each cell line. The values for the latter are expressed as percentages of the average values for the WT HeLa cell line. The calculations were based on three independent determinations. The error bars indicate two standard deviations (SD) of the means. p indicates the significance, according to the t-test, of the differences between mutant and control cell lines. ∗p < 0.05; ∗∗p < 0.001; ∗∗∗p < 0.0001; ns, not significant. E, average levels of subunits from each complex of OXPHOS (5 of complexes I, 2 of II, 3 of III, 4 of IV, and 3 of V). The calculations were based on three independent determinations. Graph details and symbols are explained as above. F, western blot analysis of Clpp involved in mitochondrial ribosome assembly and LONP1 that is a nuclear-encoded mitochondrial protease.