IMAGE

Figure 2:

ID
ZDB-IMAGE-220220-38
Source
Figures for Rawson et al., 2022
Image
Figure Caption

Figure 2:

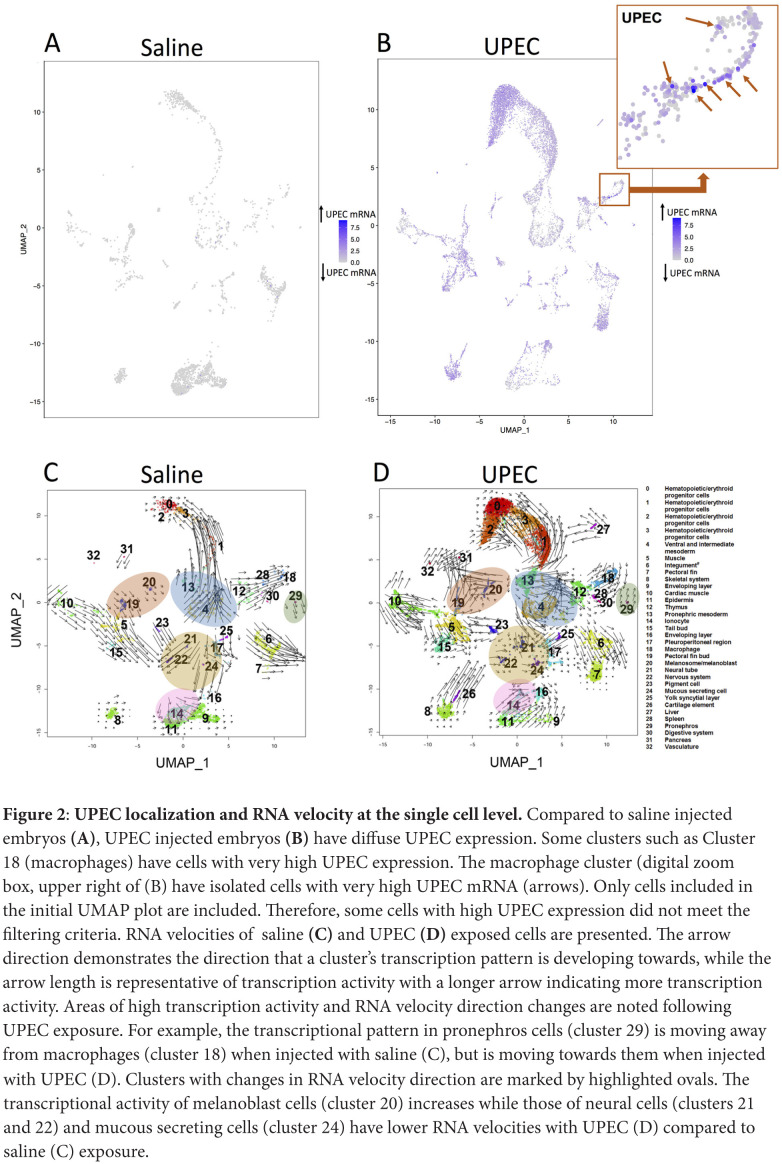
UPEC localization and RNA velocity at the single cell level. Compared to saline injected embryos (A), UPEC injected embryos (B) have diffuse UPEC expression. Some clusters such as Cluster 18 (macrophages) have cells with very high UPEC expression. The macrophage cluster (digital zoom box, upper right of (B) have isolated cells with very high UPEC mRNA (arrows). Only cells included in the initial UMAP plot are included. Therefore, some cells with high UPEC expression did not meet the filtering criteria. RNA velocities of saline (C) and UPEC (D) exposed cells are presented. The arrow direction demonstrates the direction that a cluster's transcription pattern is developing towards, while the arrow length is representative of transcription activity with a longer arrow indicating more transcription activity. Areas of high transcription activity and RNA velocity direction changes are noted following UPEC exposure. For example, the transcriptional pattern in pronephros cells (cluster 29) is moving away from macrophages (cluster 18) when injected with saline (C), but is moving towards them when injected with UPEC (D). Clusters with changes in RNA velocity direction are marked by highlighted ovals. The transcriptional activity of melanoblast cells (cluster 20) increases while those of neural cells (clusters 21 and 22) and mucous secreting cells (cluster 24) have lower RNA velocities with UPEC (D) compared to saline (C) exposure.

Acknowledgments
This image is the copyrighted work of the attributed author or publisher, and ZFIN has permission only to display this image to its users. Additional permissions should be obtained from the applicable author or publisher of the image. Full text @ Pathog Immun