
|
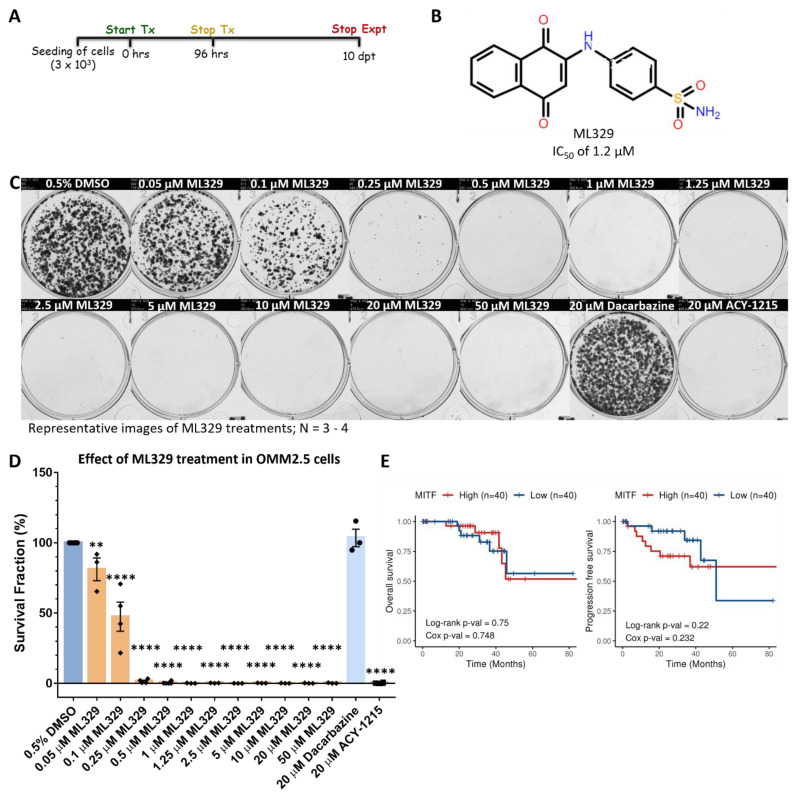
Figure 9
Inhibition of MITF pathway reduces OMM2.5 cell proliferation in vitro. (A): Schematic diagram of treatment regime. Days post treatment (dpt). (B): Chemical structure of ML329, a small molecule MITF pathway inhibitor. (C): Representative image of clonogenic assay plates for OMM2.5 cells treated with 0.5% DMSO, 0.05–50 μM ML329, 20 μM Dacarbazine or 20 μM ACY-1215 for 96 h. (D): A dose-dependent, significant reduction in the number of OMM2.5 colonies was observed in ML329 treatment groups compared to the 0.5% DMSO treatment group. One-way ANOVA with Dunnett’s Test for Multiple Comparisons statistical analysis was performed; error bars represent mean ± SEM, **, p = 0.005, ****, p = 0.0001 (N = 3–4). (E): Kaplan–Meier survival curves demonstrating no correlation between expression of MITF and overall survival (OS) or progression-free survival (PFS) in UM patients. Median values were used as cut-off for high (red) and low (blue) expression levels, with Log-rank p-values (categorical variable) and Cox p-values (continuous variable) calculated (n = 80).