
|
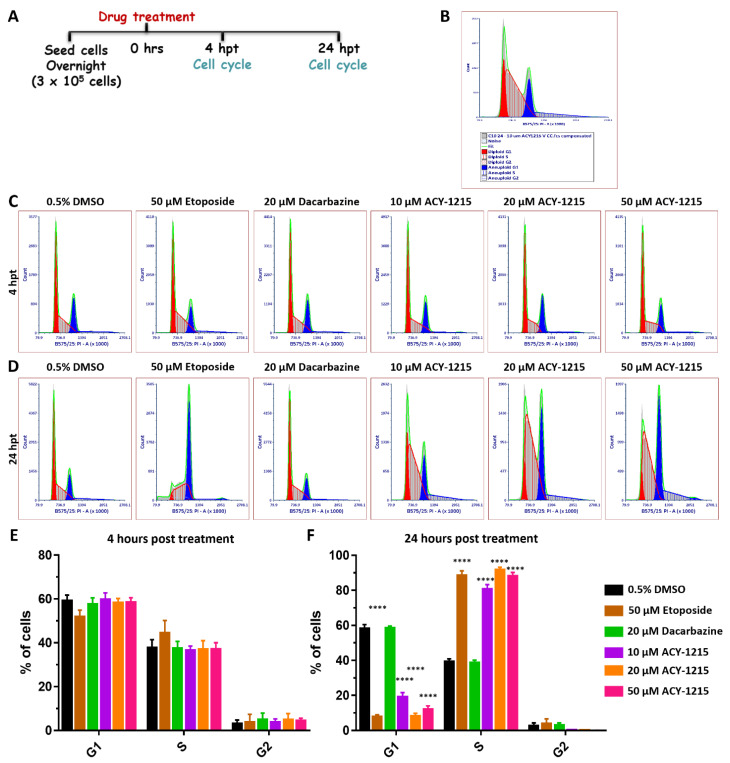
Figure 7
Cell cycle progression is arrested in the S phase by ACY-1215 in OMM2.5 cells. (A): Schematic illustrating treatment protocol undertaken. Hours post treatment (hpt). (B): Flow cytometry data analysis plot legend. (C,E): 4 h of treatment with 10, 20 or 50 μM ACY-1215, or 50 μM Etoposide or 20 μM Dacarbazine did not alter the cell cycle profile. (D,F): A significant (****, p = 0.0001) reduction in the percentage of cells in G1 phase and a significant (****, p = 0.0001) increase in the percentage of cells in the S phase were observed after 24 hpt with 10, 20 or 50 μM ACY-1215 or 50 μM Etoposide, in comparison to vehicle control. No changes in the cell cycle phases were observed following 20 μM Dacarbazine treatment. No alterations to G2 phase were observed in all treatment groups. Statistical analysis was performed by two-way ANOVA with Dunnett’s Test for Multiple Comparisons and data represented as mean ± SEM (N = 4).