
Image
|
Figure Caption
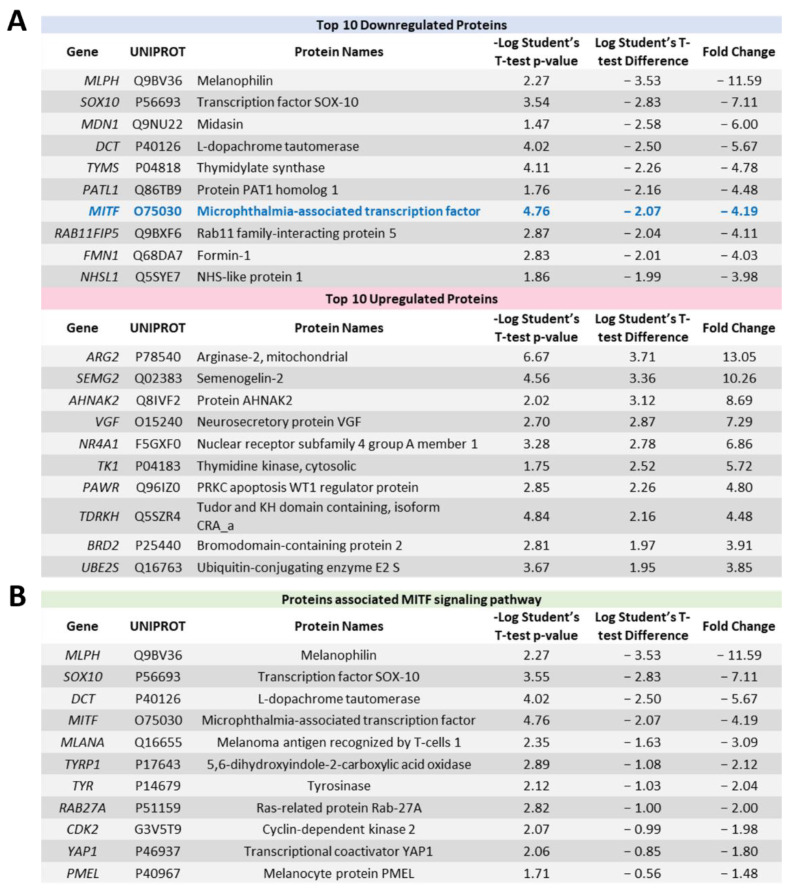
Figure 5
Significantly altered proteins identified by proteomic profiling following ACY-1215 treatment in OMM2.5 cells for 24 h. (A): Table highlighting the top 10 most down and upregulated proteins at 24 h post treatment (hpt) with 20 μM ACY-1215. (B): List of proteins involved in the MITF signaling pathway that were downregulated upon 20 μM ACY-1215 treatment for 24 h.
Acknowledgments
This image is the copyrighted work of the attributed author or publisher, and
ZFIN has permission only to display this image to its users.
Additional permissions should be obtained from the applicable author or publisher of the image.
Full text @ Cancers