
|
Figure 3
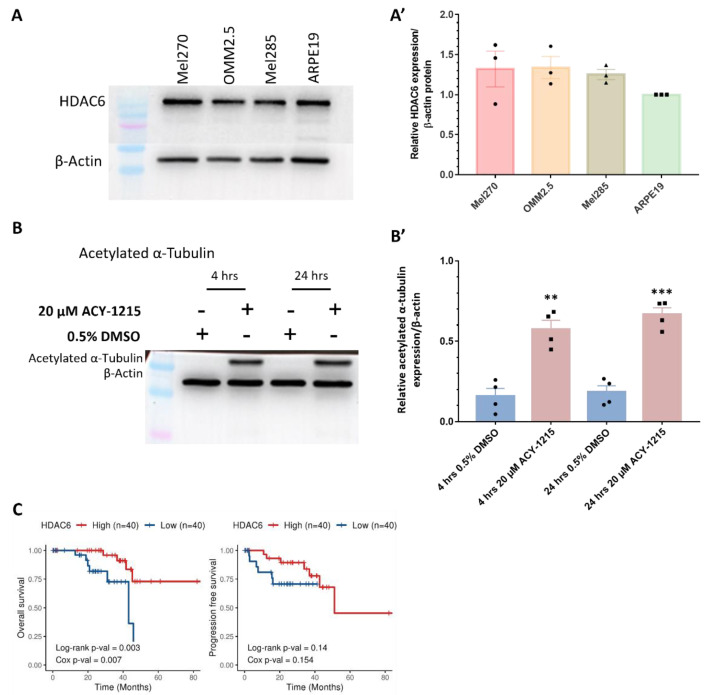
Expression and activity of HDAC6 in UM/MUM cells. (A,A’): HDAC6 is expressed in Mel270, OMM2.5, Mel285 and ARPE19 cells (N = 3). (B,B’): 20 μM ACY-1215 treatment significantly increased acetylated α-tubulin expression levels at 4 h post treatment (hpt) (**, p = 0.0013) and 24 hpt (***, p = 0.0002) compared to 0.5% DMSO treatment. Student’s Unpaired T test statistical analysis was performed, and data are presented as mean ± SEM. Representative blots for each protein probed and densitometry analysis presented, plus raw blots are provided in Supplementary Figures S3 and S7. (C): Kaplan–Meier survival curves assessing correlation between expression of HDAC6 and overall survival (OS) or progression-free survival (PFS) in UM patients. Median values were used as cut-off for high (red) and low (blue) expression levels, with Log-rank p-values (categorical variable) and Cox p-values (continuous variable) calculated (n = 80).