
|
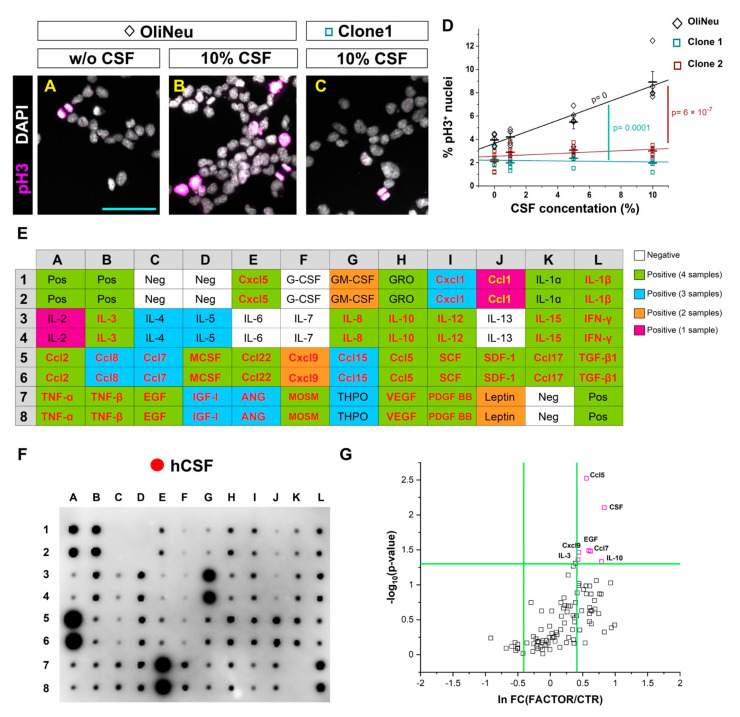
Figure 7
In vitro screening to identify potential candidates from the human cerebrospinal fluid inducing OPC proliferation. (A–C) Micrographs illustrating the proportion of proliferating (pH3 positive) cells in a control wildtype (WT) (A,B) and Tlr2 and Cxcr3-deficient (C) OliNeu oligodendrocyte progenitor cell line in basal conditions (A) and in response to the CSF treatment (B,C). (D) Dot-plot depicting the proportion of proliferating WT and Tlr2 and Cxcr3-deficient Oli-Neu cells after CSF treatment. The line indicates the corresponding linear data-fit. Data are shown as mean ± SEM; each data point represents one independent experiment. Adjusted p-values assess the quality of the linear fit for the WT clone (black) and difference in the slopes of the linear fits (color-coded) using the linear regression model. (E) Table showing the map of the array in (F). Color-code illustrates the presence of each cytokine in CSF samples (White: negative in all samples; Green: positive in all samples; Blue: positive in 3 out 4 samples; Orange: positive in 2 out of 4 samples; Magenta: Positive in 1 out 4 samples). Cytokines names colored in red or yellow were selected for the screening in (G). (F) Representative image of a cytokine antibody array depicting the cytokine composition of a healthy donor-derived CSF. (G) Dot plot depicting proliferation of Oli-Neu cells after treatment with different cytokines and CSF. Scale bars in (A–C) = 50μm Abbreviations: hCSF: human cerebrospinal fluid. Symbol description: Black diamond: control OliNeu cells; green square: Tlr2 and Cxcr3-deficient clone 1; red square Tlr2 and Cxcr3-deficient clone 2; red circle: human CSF administration.