
Image
|
Figure Caption
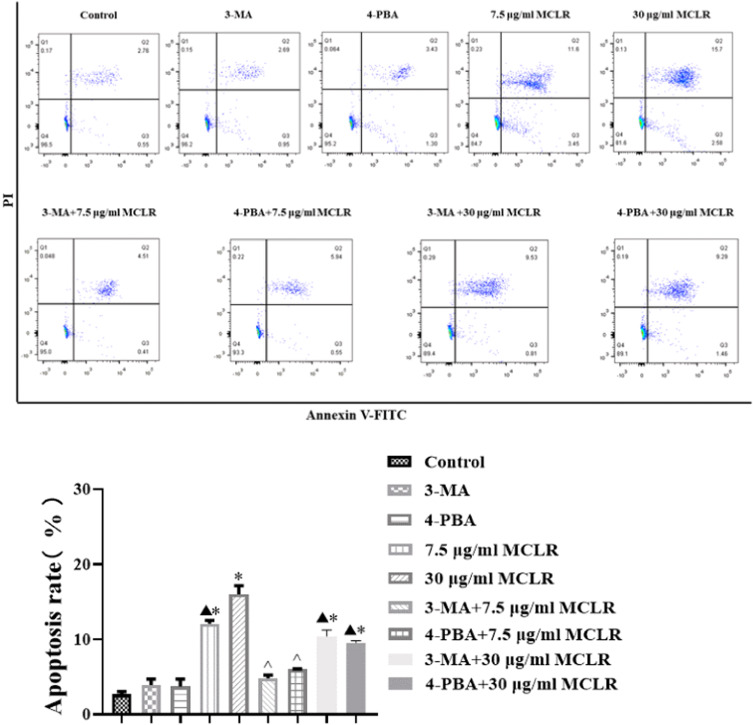
Fig. 7 Apoptosis rate of TM4 cells after different treatment was detected by flow cytometry (n = 3 per group). * P < 0.05 significantly different from control group. ^P < 0.05 significantly different from 7.5 μg/mL MCLR. ▲P < 0.05 significantly different from 30 μg/mL MCLR.
Acknowledgments
This image is the copyrighted work of the attributed author or publisher, and
ZFIN has permission only to display this image to its users.
Additional permissions should be obtained from the applicable author or publisher of the image.
Full text @ Ecotoxicol. Environ. Saf.