
Image
|
Figure Caption
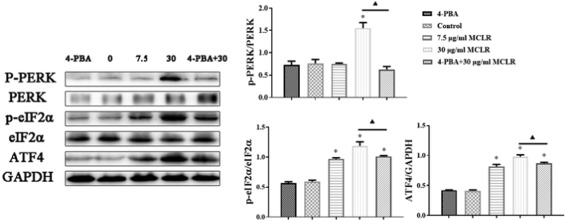
Fig. 6 The bands of PERK, p-PERK, eIF2α, p-IF2α, ATF4 and GAPDH expression levels measured by using Western blotting assay in TM4 cells (n = 3). * P < 0.05 significantly different from control group. ▲P < 0.05 significantly different from 30 μg/mL MCLR.
Acknowledgments
This image is the copyrighted work of the attributed author or publisher, and
ZFIN has permission only to display this image to its users.
Additional permissions should be obtained from the applicable author or publisher of the image.
Full text @ Ecotoxicol. Environ. Saf.