
Image
|
Figure Caption
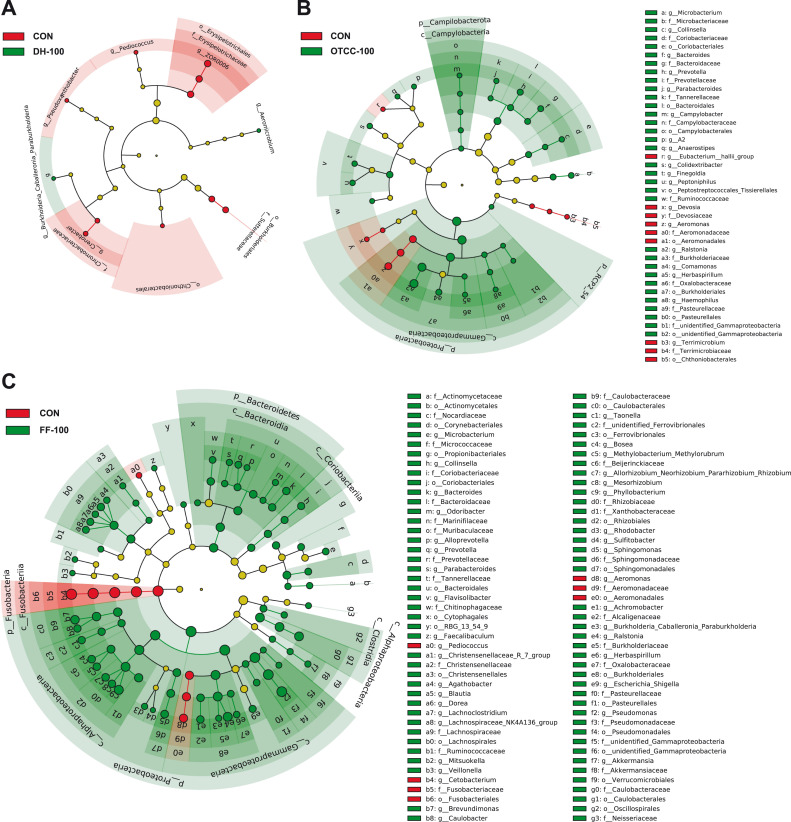
Fig. 4 Linear discriminant analysis effect size (LEfSe) comparison analysis between the control group and the antibiotic-treated group (LDA score > 2). A: DH-100 group; B: OTCC-100 group; C: FF-100 group.
Figure Data
Acknowledgments
This image is the copyrighted work of the attributed author or publisher, and
ZFIN has permission only to display this image to its users.
Additional permissions should be obtained from the applicable author or publisher of the image.
Full text @ Ecotoxicol. Environ. Saf.