
Image
|
Figure Caption
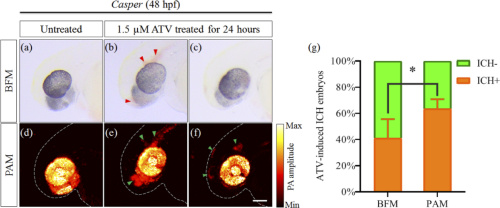
Fig. 6 Imaging of the casper zebrafish embryos without and with ATV treatment (ICH model): representative images and statistical study. (a)−(c) BFM images. (d)−(f) PAM images. For each column, the same region of the same zebrafish sample was imaged. The identified ICH regions are marked by the triangles. Scale bar: 100 µm. All images share the same scale bar. (g) Statistical study results for ICH identification. SD is denoted by the error bars. *P = 0.0339 (by Tukey's test).
Acknowledgments
This image is the copyrighted work of the attributed author or publisher, and
ZFIN has permission only to display this image to its users.
Additional permissions should be obtained from the applicable author or publisher of the image.
Full text @ Biomed. Opt. Express