IMAGE

Figure 5.

ID
ZDB-IMAGE-220214-30
Source
Figures for Minnoye et al., 2020
Image
Figure Caption

Figure 5.

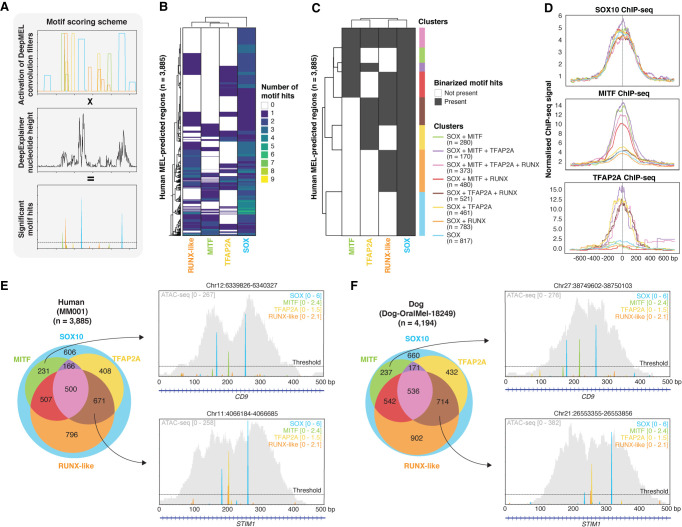
Core Regulatory Complex of MEL melanoma enhancers. (A) Schematic overview of motif scoring method in which extended convolutional filter hits from DeepMEL are multiplied by DeepExplainer profiles to yield significant motif hits. (B,C) Heatmap (B) and binarized heatmap (C) of the number of significant SOX, TFAP2A, MITF, and RUNX-like motif hits on the 3885 MEL-predicted regions in the human cell line MM001. (D) Aggregation plot of normalized ChIP-seq signal of SOX10, MITF, and TFAP2A on the human enhancer clusters. (E,F) Venn diagram of regions clusters on the 3885 MEL-predicted regions in human (in MM001) (E) and the 4194 MEL-predicted regions in dog (in Dog-OralMel-18249) (F). Example MEL-predicted enhancers in human and dog are shown for two of the region clusters. The ATAC-seq signal of the regions is shown in gray.

Acknowledgments
This image is the copyrighted work of the attributed author or publisher, and ZFIN has permission only to display this image to its users. Additional permissions should be obtained from the applicable author or publisher of the image. Full text @ Genome Res.