IMAGE

Fig. 4

ID
ZDB-IMAGE-220213-7
Source
Figures for Barbieri et al., 2022
Image
Figure Caption

Fig. 4

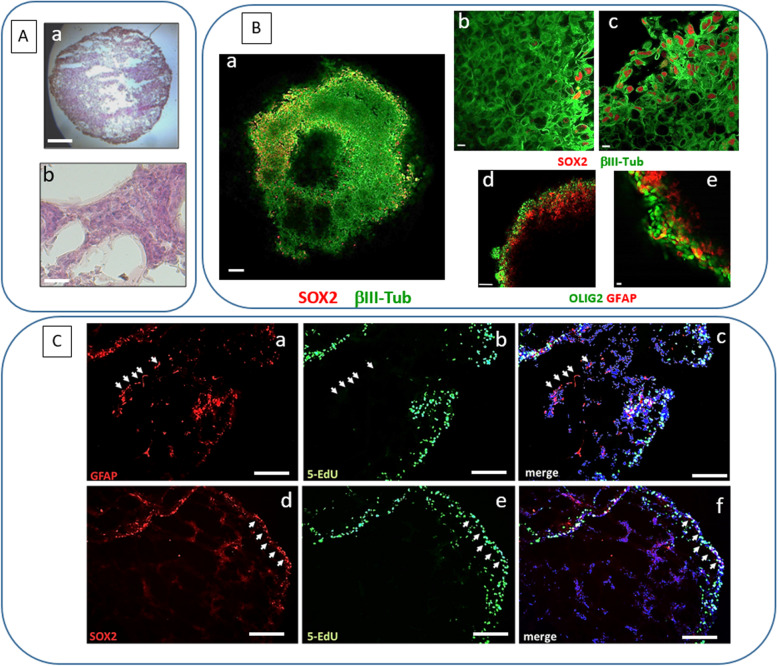
Characterization of GSC 3D organoids. A Hematoxylin & eosin staining of GSC organoid sections, after 3 weeks of cultures: cells are organized in a tissue-like layered structure. a: bar = 500 μm; b: bar = 50 μm. B Immunofluorescence images of the whole GSC organoid structure labelled with Sox2 (red) and β-III tubulin (green) (a: bar = 100 μm; b and c: bar = 10 μm), or Olig2 (green) and GFAP (red) (d: bar = 100 μm; e: bar = 10 μm) obtained by confocal microscopy. Cells expressing stem cell markers, Sox2 and Olig2, display a peripheral localization as compared to differentiated cells expressing β-III tubulin and GFAP. C Immunofluorescent labelling for GFAP (red, upper pictures) and Sox2 (red, lower pictures) performed on slices of GSC organoids after 3 weeks of cultures, incubated with 5-EdU (green), to mark actively proliferating cells. Nuclei are counterstained with DAPI (blue). White arrows highlight that most proliferating cells are Sox2-positive and localized at the periphery of the organoid; conversely, most GFAP-positive cells display an inner localization and are not co-labelled by 5-EdU. Bar = 200 μm

Acknowledgments
This image is the copyrighted work of the attributed author or publisher, and ZFIN has permission only to display this image to its users. Additional permissions should be obtained from the applicable author or publisher of the image. Full text @ J. Exp. Clin. Cancer Res.