
Fig. 5
- ID
- ZDB-IMAGE-220212-7
- Publication
- Höijer et al., 2022 - CRISPR-Cas9 induces large structural variants at on-target and off-target sites in vivo that segregate across generations
- All Figures
- Figures for Höijer et al., 2022
|
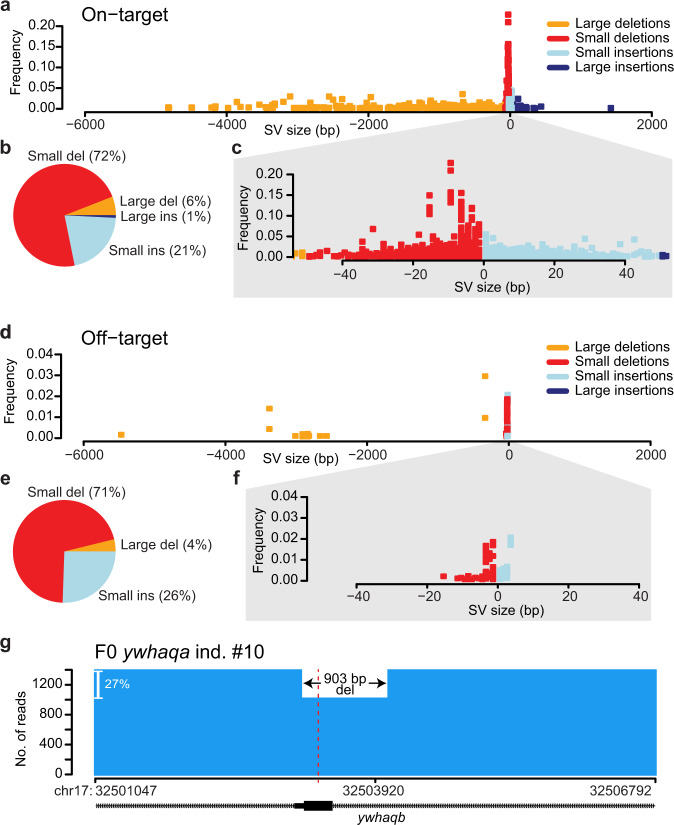
Fig. 5 a A dot plot showing the size distribution of Cas9-induced on-target mutation events (large and small insertions and deletions) in pools of founder larvae. Each point in the graph visualizes a specific event in a sample, where the x-axis displays the size of the variant (negative values for deletions and positive values for insertions), and the y-axis displays the frequency of the variant in the individual sample. b Fractions of small and large insertions and deletions at on-target sites in pools of founder larvae. c Zoomed-in view of the plot in (a), only visualizing small insertions and deletions. d Size distribution of Cas9-induced off-target mutations (sh2b3 off-target 1, ywhaqa off-target 1 and 2) in pools of founder larvae. e Fractions of small and large insertions and deletions at the three off-target sites in pools of founder larvae. f Zoomed-in view of the plot in d), only visualizing small insertions and deletions. g An example of an adult founder fish with a 903 bp deletion at ywhaqa’s off-target 2 that spans an entire exon of ywhaqb. The coverage plot shows the number of reads with the 903 bp deletion and the number of reads that lack the deletion (i.e., unmodified and other Cas9-induced variants). The Cas9 cleavage site is indicated by the dashed red line. Source data are provided as a Source Data file.