
|
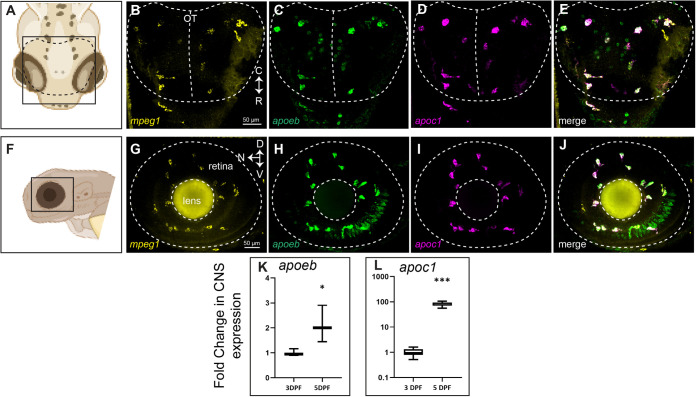
Fig. 4.
Multiplex detection of mpeg1, apoc1, and apoeb transcripts in the developing zebrafish CNS. HCR probe sets were used to detect mpeg1, apoc1, and apoeb transcripts in whole zebrafish embryos at 3 dpf. (A) Region and orientation of imaging of the zebrafish brain. Orientation markers: C, caudal; R, rostral. (B–D) Signal from each probe set detected within the optic tectum. (E) Merge of all three probe set signals. The region indicated by the dotted lines pertains to the optic tectum. (F) Region and orientation of imaging of the zebrafish eye/retina. Orientation markers: D, dorsal; N, nasal; V, ventral. (G–I) Signal from each probe set detected within the eye/retina. (J) Merge of all three probe set signals. The region indicated by the dotted lines pertains to the embryonic eye boundary (outer circle) as well as the lens (inner circle). In embryos, the eye is comprised nearly entirely of lens and retina. (K,L) Fold change in expression in heads from 3 to 5 dpf of apoeb (K) and apoc1 (L) measured by RT-qPCR. Images in A and F were generated in BioRender. Images are representative of n=6 embryos.