
|
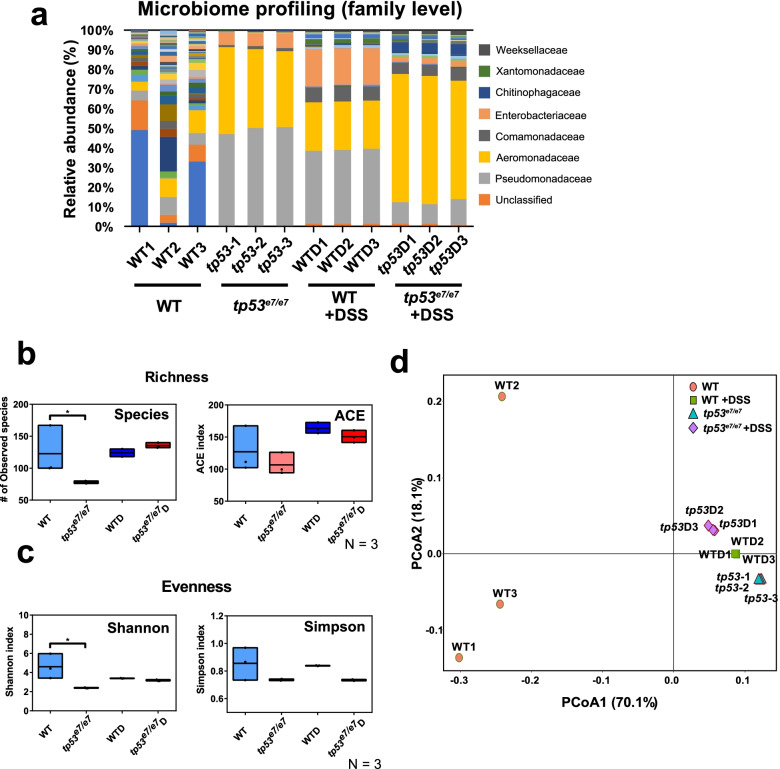
Fig. 2 tp53 mutants harbor intestinal dysbiosis revealed by metagenome analysis. a Metagenome analysis of the intestinal microbiota of WT and tp53 mutants with or without DSS treatment at a family level. Each family is color-coded according to the key panel on the right. Each sample was repeated three times. b, c Alpha diversity (richness and evenness) comparison of the microbiota of WT, tp53 mutants, WT+DSS (WTD), and tp53 mutants + DSS (tp53D). d Principle coordinate analyses (PCoA, unweighted) visualizing the microbiotal relationship of samples from different conditions. PCoA scores were plotted based on the relative abundance of OTUs of taxonomic families of gut microbiota from WT and tp53 mutants. Samples from the same conditions were grouped together except WT samples. The boxed plots in (b) and (c) were statistically estimated by one-way ANOVA followed by Newman-Keuls multiple comparisons test. Data are represented as mean ± SEM. *< p = 0.05