
IMAGE
Fig. 2
- ID
- ZDB-IMAGE-220131-556
- Publication
- Bergen et al., 2022 - Regenerating zebrafish scales express a subset of evolutionary conserved genes involved in human skeletal disease
- All Figures
- Figures for Bergen et al., 2022
Image
|
Figure Caption
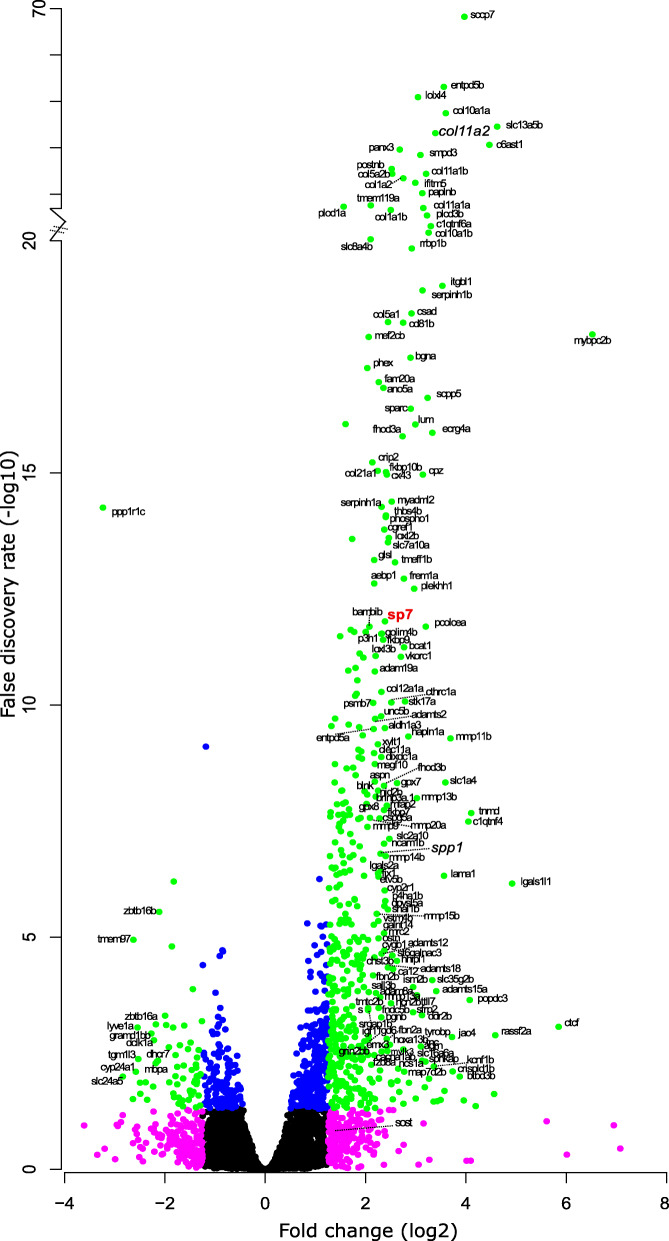
Fig. 2
Volcano plot of RNA-seq data comparing expression between ontogenetic and 9 days post-harvest regenerating scales. Relative fold change (log2) and false discovery rate (-log10 converted) of coding RNA sequences that were expressed in both ontogenetic and regenerating scales. Green (≥±1.25 fold change, ≥ 1.3 FDR), magenta (≥±1.25 fold change, < 1.3 FDR), blue (<±1.25 fold change, ≥1.3 FDR), and black (not passing any threshold) coloured dots mark the different criteria
Acknowledgments
This image is the copyrighted work of the attributed author or publisher, and
ZFIN has permission only to display this image to its users.
Additional permissions should be obtained from the applicable author or publisher of the image.
Full text @ BMC Biol.