
|
Fig. 7
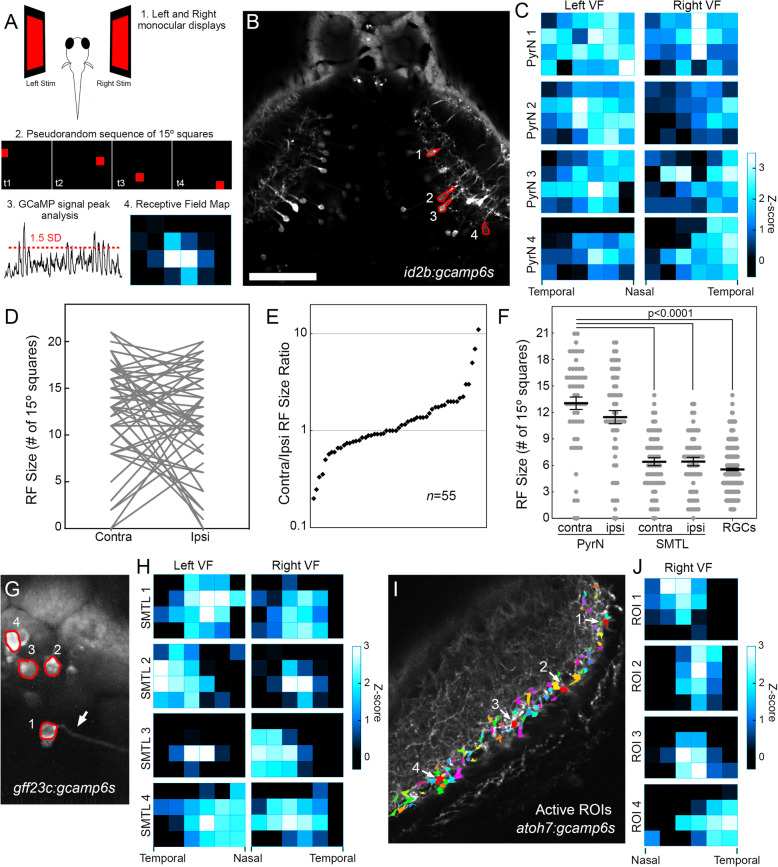
Visual receptive fields of PyrNs, SMTLs, and RGCs. A Overview of experimental design to monitor ramp-evoked responses in elements of the tectum-TL circuit. Left and right displays are used to present single 15° squares within a 6x4 checkerboard in a pseudorandom pattern. GCaMP6s signal intensity was used to quantify response strength at each position. Position response strength was subsequently used to generate RF maps. B Maximum projection image of an image timeseries acquired in tectum of a id2b:gcamp6s larva presented with RF mapping stimuli. C Example RF maps for the four PyrNs indicated in B. Note large, complex RFs and asymmetries in RF size between left and right visual fields. D Quantification of RF size in contralateral and ipsilateral RFs of individual PyrNs. Note high degree of variability in RF size and contra/ipsi ratio. E Distribution of contra/ipsi RF size ratio for 55 PyrNs recorded in 7 larvae. F Comparison of RF size in PyrNs, SMTLs, and RGCs. One-way ANOVA with Tukey’s multiple comparisons test, p<0.0001 for comparisons between each indicated group and the contra-PyrN group. G Maximum projection image of an image timeseries acquired in TL of a gff23c:gcamp6s larva presented with RF mapping stimuli. Arrow denotes SMTL with visible axon extending towards the right tectal lobe. H Example RF maps for the four SMTLs indicated in G. Note large, but discrete RFs and asymmetries in RF size between left and right visual fields. I Maximum projection image of an image timeseries acquired in the left tectum of a atoh7:gcamp6s larva presented with RF mapping stimulus to the right eye. Overlaid on this image are active RGC ROIs detected in response to presentation of a 30s luminance ramp stimulus to the right eye. Arrows denote four RGC ROIs at distinct positions along the A–P axis. J Example RF maps for the four RGC ROIs indicated in I. Note compact, discrete RFs and nasal-temporal distribution of RF positions match anteroposterior position of ROIs in the tectum. Scale bar: 75μm in B, 25μm in G, and 40μm in I