
Figure 4
- ID
- ZDB-IMAGE-220131-513
- Publication
- Prendergast et al., 2022 - Phenotyping Zebrafish Mutant Models to Assess Candidate Genes Associated with Aortic Aneurysm
- All Figures
- Figures for Prendergast et al., 2022
|
Figure 4
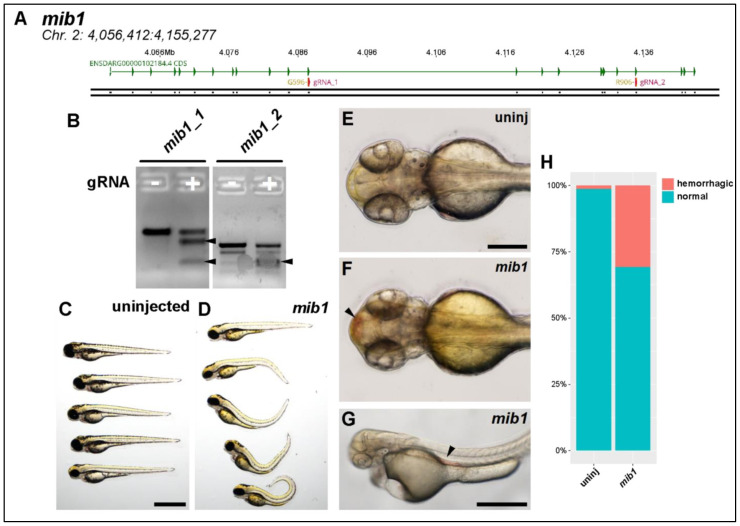
Knocking out mib1 generates a hemorrhagic phenotype. (A) Genomic region of chromosome 2 containing mib1 gene. Two patient mutations G596 and R906 are indicated. gRNAs (magenta) were designed to target both regions. (B) T7 endonuclease activity against gRNA target amplicons. Uninjected DNA pool (−) produces one fragmentation pattern, mib1-injected DNA pool (+) produces extra bands (filled arrowheads) caused by heteroduplex DNA formation due to editing and subsequent digestion by T7 endonuclease. (C) Brightfield macroscopic image of representative series of uninjected larvae at 3 dpf. Scale bar: 1 mm. (D) Similar image of mib1 knockout fish. Note severe body curvature defects. (E) Uninjected 54 hpf fish, dorsal view. Scale bar: 250 µm. (F) Similar mib1 knockout fish exhibiting cranial hemorrhage (filled arrowhead). (G) Brightfield image of 50 hpf mib1 knockout fish with aortic hemorrhage (filled arrowhead, scale bar: 500 µm). (H) Quantification of hemorrhagic phenotype. Mib1 knockout fish exhibit significantly more hemorrhagic events (uninj: 1%, mib1: 31%, chi-square test, p < 0.001).