
IMAGE
Figure 5
- ID
- ZDB-IMAGE-220131-493
- Publication
- Lu et al., 2022 - Effect of Lipopolysaccharides on Liver Tumor Metastasis of twist1a/krasV12 Double Transgenic Zebrafish
- All Figures
- Figures for Lu et al., 2022
Image
|
Figure Caption
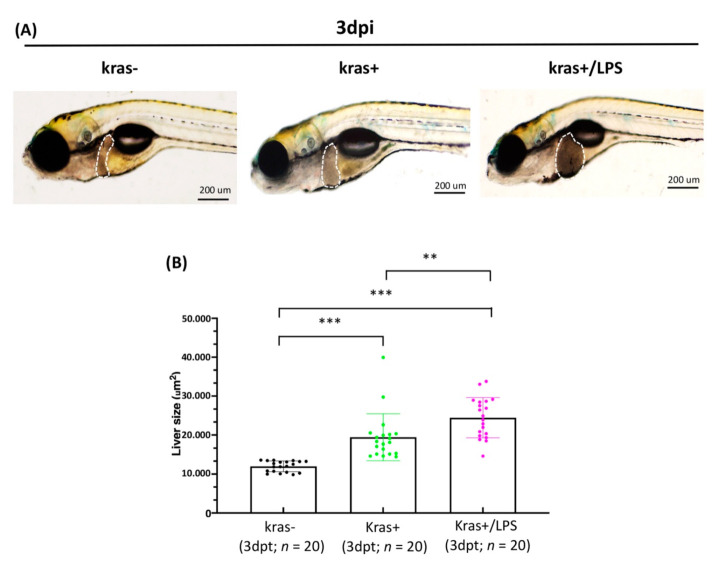
Figure 5
LPS increased liver size in kras+ transgenic zebrafish larvae. (A) Representative images and (B) quantification of liver size in wild-type (kras−) control, kras+, and kras+/LPS zebrafish at 3 dpi (white dotted frame: liver; black dots; green dots; pink dots: the number of zebrafish larvae, respectively). Scale bar: 200 μm. Student’s t-tests were used to assess differences between variables: ** p < 0.01, *** p < 0.001.
Figure Data
Acknowledgments
This image is the copyrighted work of the attributed author or publisher, and
ZFIN has permission only to display this image to its users.
Additional permissions should be obtained from the applicable author or publisher of the image.
Full text @ Biomedicines