
|
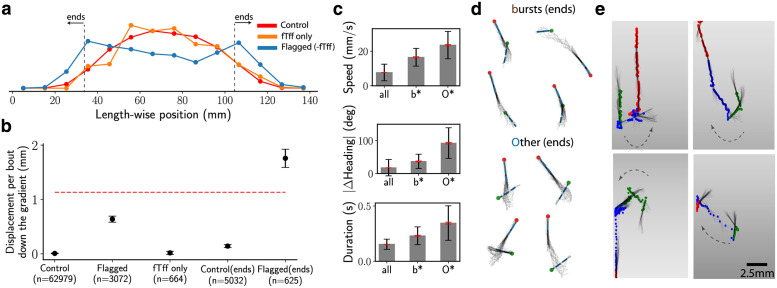
Fig 6 (a) Distributions of length-wise positions for the Control bouts (all bouts from aversive environment except the ones from sequences flagged as over-represented in Table 2), fTff only and Flagged bouts (from the sequences in Table 2) except fTff in red, orange and blue respectively. (b) The length-wise displacement travelled in a bout down the gradient for bouts tagged as Control, Flagged (as defined in (a)), fTff only, Control(ends) (all bouts from the two ends of well shown in (a)), Flagged(ends) (flagged but with fTff removed and in the ends of the well). For scale, the red, dashed line shows the mean length-wise distance per bout for unflagged bouts. Error bars are s.e.m. (c) The mean speed, change in heading and duration of the bouts (black, red error bars for s.d, s.e.m respectively) from b and O bout types that are part of the Flagged(ends) sequences from (b). (d) Superimposed images for four random samples of b and O bout types from the flagged sequences in (a). The green and red are the head positions at the beginning and end of the bout respectively. (e) Superimposed images for four random samples highlighting the Flagged(ends) sequences (blue dots), which include the three bouts before (green dots) and after (red dots) the flagged sequence. Note that the depicted gradient is illustrative.