
Fig. 5
- ID
- ZDB-IMAGE-220131-401
- Publication
- Uribe-Salazar et al., 2022 - Evaluation of CRISPR gene-editing tools in zebrafish
- All Figures
- Figures for Uribe-Salazar et al., 2022
|
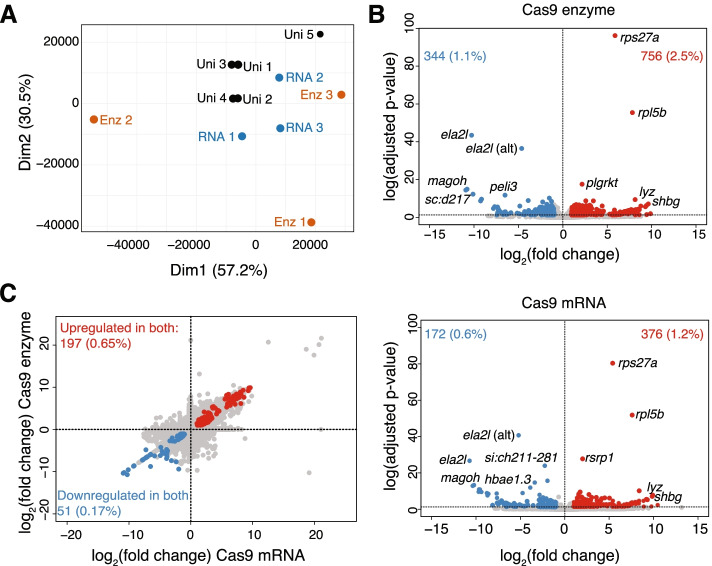
Fig. 5 Evaluation of expression variability in CRISPR-injection controls. A Principal components analysis using the transcript abundances in larvae injected with Cas9 enzyme (Enz1, Enz2, Enz3), Cas9 mRNA (RNA1, RNA2, RNA3), uninjected siblings (Uni1, Uni2), and uninjected siblings from a different batch (Uni3, Uni4, Uni5). B Volcano plots show the differentially-expressed genes in Cas9-enzyme and Cas9-mRNA injected larvae with the number (and %) of upregulated (fold change > 1) and downregulated (fold change < − 1) genes. The top five representative up- and downregulated genes are highlighted, with the full list of genes available as Supplementary Table 6. C Differentially-expressed genes across samples injected with Cas9 enzyme or Cas9 mRNA relative to uninjected batch-siblings show significant correlations. Plots include the numbers and percentages (in parentheses) of genes downregulated (blue) and upregulated (red) in both Cas9 treatments from the total amount of genes assayed (n = 30,258)