
FIGURE 3
- ID
- ZDB-IMAGE-220131-358
- Publication
- Xia et al., 2021 - Metal transporter Slc30a1 controls pharyngeal neural crest differentiation via the zinc-Snai2-Jag1 cascade
- All Figures
- Figures for Xia et al., 2021
|
FIGURE 3
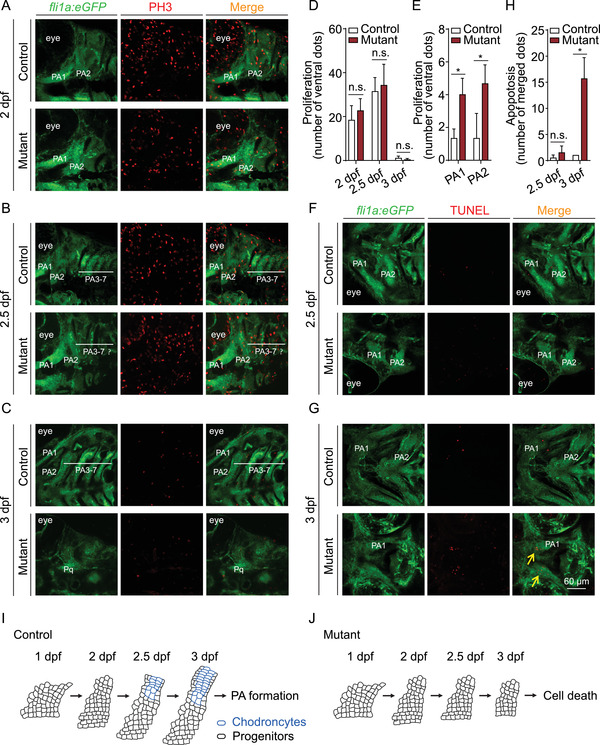
Summary of cell death and cell proliferation in the PA of control and slc30a1a/slc30a1b double‐knockout mutant embryos. (A–C) PH3 immunostaining (red) was performed in order to detect cell proliferation in the pharyngeal arch (PA) of control and mutant Tg(fli1a:eGFP) embryos at the indicated ages. (D) Summary of PH3‐positive cells in the PA of control and mutant embryos at the indicated ages; n.s., not significant. (E) Summary of PH3‐positive cells in the ventral region of PA1 and PA2 in control and mutant embryos at 2 dpf. *p < 0.05. (F and G) A TUNEL assay (red) was used to detect apoptotic cells in the PA area of control and mutant Tg(fli1a:eGFP) embryos at the indicated ages. (H) Summary of TUNEL‐positive cells in the PA area of control and mutant embryos at the indicated ages. (I and J) Schematic drawing depicting PA development in control (I) and mutant (J) embryos. Chondrocytes that differentiate from progenitor cells around 2.5 dpf in controls are shown in blue; in embryos, these cells fail to differentiate and do not survive beyond 2.5 dpf