
IMAGE
Figure 3
- ID
- ZDB-IMAGE-220131-328
- Publication
- Gong et al., 2021 - Establishment of a Dihydrofolate Reductase Gene Knock-In Zebrafish Strain to Aid Preliminary Analysis of Congenital Heart Disease Mechanisms
- All Figures
- Figures for Gong et al., 2021
Image
|
Figure Caption
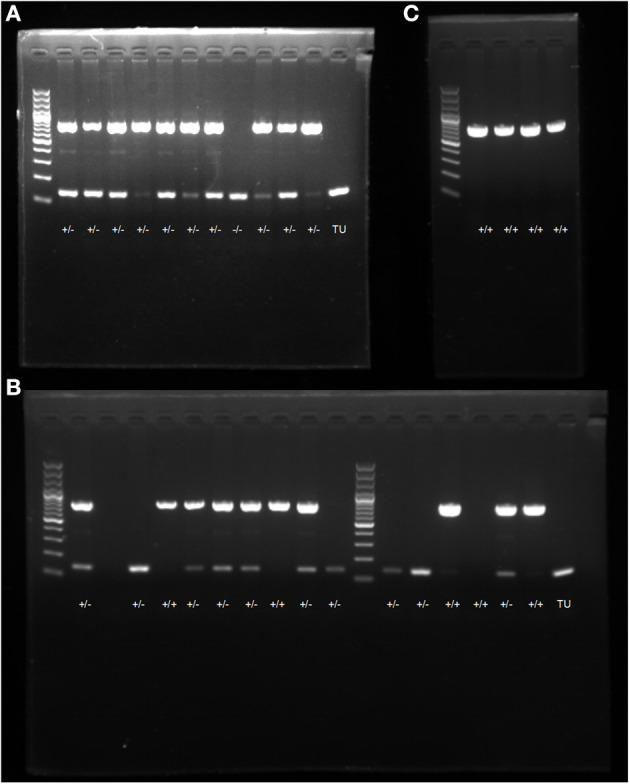
Figure 3
PCR electrophoresis diagram. (A) screening and genotype identification of F1 generation zebrafish; (B) identification of positive expressions of genotypes in zebrafish; (C) self-progeny genotype identification of F1 generation heterozygous zebrafish.
Acknowledgments
This image is the copyrighted work of the attributed author or publisher, and
ZFIN has permission only to display this image to its users.
Additional permissions should be obtained from the applicable author or publisher of the image.
Full text @ Front Cardiovasc Med