
Image
|
Figure Caption
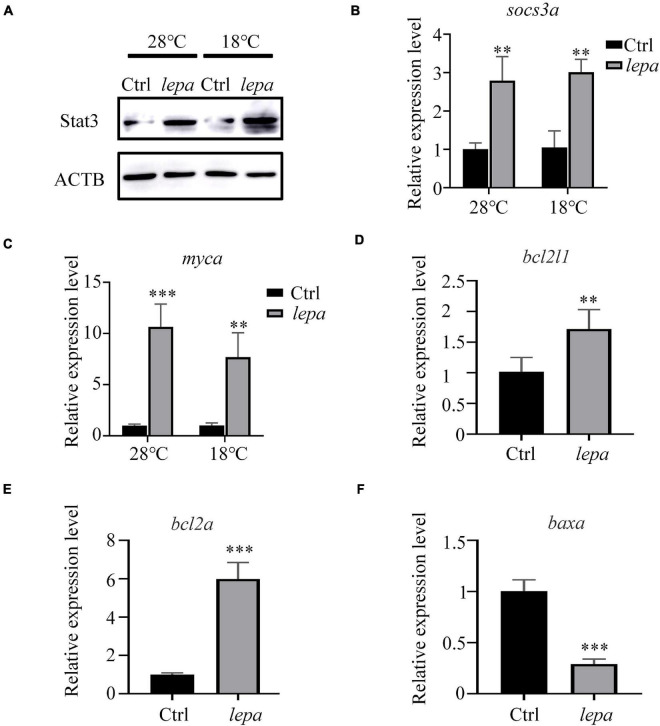
FIGURE 6
Activation of stat3 signal pathway in DM-lepa-over-expressed cells. (A) Western blot analysis of the protein expression level of STAT3 in the cell lysates of the DM-lepa over-expression group and the control group. (B–F) A qRT-PCR assay of SOCS3/socs3a, c-myc/myca, Bcl-xl/bcl2l1, Bcl2/bcl2a, and Baxa/baxa mRNAs in control and DM-lepa transfected cells. The results are presented as mean ± SD (n = 3), **P < 0.01, ***P < 0.001.
Acknowledgments
This image is the copyrighted work of the attributed author or publisher, and
ZFIN has permission only to display this image to its users.
Additional permissions should be obtained from the applicable author or publisher of the image.
Full text @ Front. Physiol.